(This is a sponsored article.) In this tutorial, you will build a simple weather dashboard from scratch. It will be a client-end application that is neither a “Hello World” example, nor too intimidating in its size and complexity.
The entire project will be developed using tools from the Node.js + npm ecosystem. In particular, we will be heavily relying on the Dark Sky API for the data, Vue.js for all the heavy lifting, and FusionCharts for data visualization.
Prerequisites
We expect that you are familiar with the following:
HTML5 and CSS3 (we will also be using the basic features provided by Bootstrap ;JavaScript (especially ES6 way of using the language);Node.js and npm (the basics of the environment and package management is just fine).
Apart from the ones mentioned above, it would be great if you have familiarity with Vue.js , or any other similar JavaScript framework. We don’t expect you to know about FusionCharts — it’s so easy to use that you will learn it on the fly!
Expected Learnings
Your key learnings from this project will be:
How to plan about implementing a good dashboard
How to develop applications with Vue.js
How to create data-driven applications
How to visualize data using FusionCharts
In particular, each of the sections take you a step closer to the learning goals:
An Introduction To The Weather Dashboard Create The Project Customize The Default Project Structure Data Acquisition And Processing Data Visualization With FusionCharts
1. The Dashboard Workflow
Before we dive into the implementation, it is important to be clear about our plan. We break our plan into four distinct aspects:
Requirements
What are our requirements for this project? In other words, what are the things that we want to showcase through our Weather Dashboard? Keeping in mind that our intended audience are probably mere mortals with simple tastes, we would like to show them the following:
Details of the location for which they want to see the weather, along with some primary information about the weather. Since there are no stringent requirements, we will figure out the boring details later. However, at this stage, it is important to note that we will have to provide the audience a search box, so that they can provide input for the location of their interest.
Graphical information about the weather of their location of interest, such as:
Temperature variation for the day of query
Highlights of today’s weather:
Wind Speed and Direction
Visibility
UV Index
Note : The data obtained from the API provides information regarding many other aspects of the weather. We choose not to use all of them for the sake of keeping the code to a minimum.
Structure
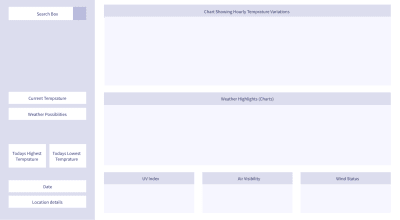
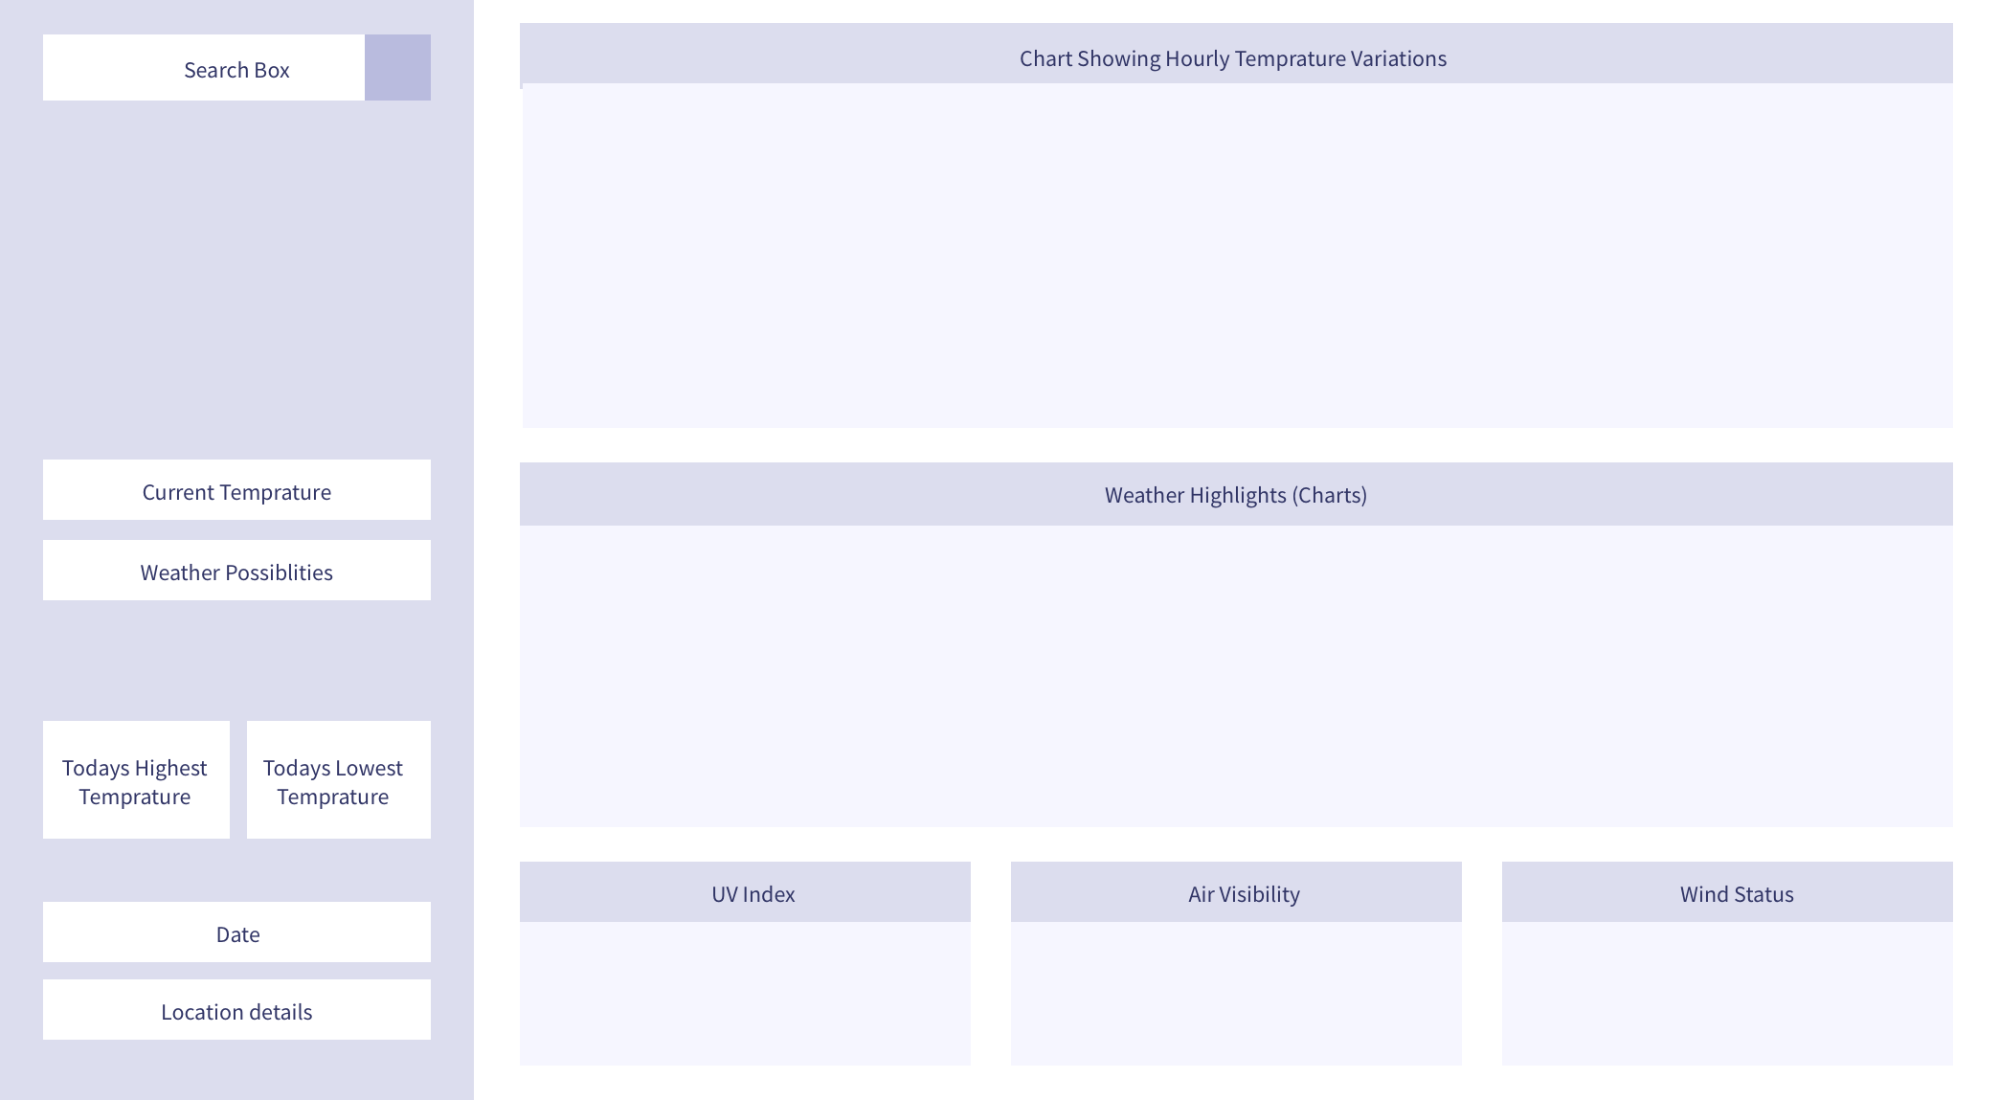
Based on the requirements, we can structure our dashboard as shown below:
(Large preview ) Data
Our dashboard is as good as the data we get, because there will be no pretty visualizations without proper data. There are plenty of public APIs that provide weather data — some of them are free, and some are not. For our project, we will collect data from the Dark Sky API . However, we will not be able to poll the API endpoint from the client end directly. Don’t worry, we have a workaround that will be revealed just at the right time! Once we get the data for the searched location, we will do some data processing and formatting — you know, the type of technicalities that helps us pay the bills.
Visualization
Once we get clean and formatted data, we plug it in to FusionCharts. There are very few JavaScript libraries in the world as capable as FusionCharts. Out of the vast number of offerings from FusionCharts, we will use only a few — all written in JavaScript, but works seamlessly when integrated with the Vue wrapper for FusionCharts .
Armed with the bigger picture, let’s get our hands dirty — it’s time to make things concrete! In the next section, you will create the basic Vue project, on top of which we will build further.
2. Creating The Project
To create the project, execute the following steps:
Install Node.js + npm If you have Node.js installed on your computer, skip this step. )here .
Once installed, it’s probably a good idea to verify if the software is working correctly, and what are their versions. To test that, open the command-line/terminal and execute the following commands:
node --version
npm --version
Install packages with npm npm install -g vue@2 vue-cli@2
Initialize project scaffolding with vue-cli vue-cli — a command-line tool from Vue.js, to initialize the project. To do that, execute the following:
Initialize the scaffolding with webpack-simple template.
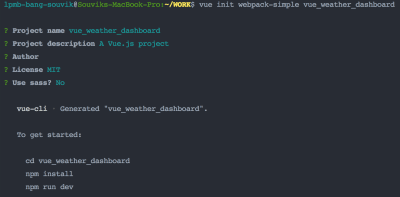
vue init webpack-simple vue_weather_dashboard
You will be asked a bunch of questions — accepting the defaults for all but the last question will be good enough for this project; answer N for the last one.
(Large preview ) Keep in mind that although webpack-simple is excellent for quick prototyping and light application like ours, it is not particularly suited for serious applications or production deployment. If you want to use any other template (although we would advise against it if you are a newbie), or would like to name your project something else, the syntax is:
vue init [template-name] [project-name]
Navigate to the directory created by vue-cli for the project.
cd vue_weather_dashboard
Install all the packages mentioned in the package.json, which has been created by the vue-cli tool for the webpack-simple template.
npm install
Start the development server and see your default Vue project working in the browser!
npm run dev
If you are new to Vue.js , take a moment to savor your latest achievement — you have created a small Vue application and its running at localhost:8080 !
(Large preview ) Brief Explanation Of The Default Project Structure
It’s time to take a look at the structure inside the directory vue_weather_dashboard, so that you have an understanding of the basics before we start modifying it.
The structure looks something like this:
vue_weather_dashboard
|--- README.md
|--- node_modules/
|     |--- ...
|     |--- ...
|     |--- [many npm packages we installed]
|     |--- ...
|     |--- ...
|--- package.json
|--- package-lock.json
|--- webpack.config.js
|--- index.html
|--- src
|     |--- App.vue
|     |--- assets
|     |     |--- logo.png
|     |--- main.js
Although it might be tempting to skip getting familiar with the default files and directories, if you are new to Vue, we strongly recommend at least taking a look at the contents of the files. It can be a good educational session and trigger questions that you should pursue on your own, especially the following files:
package.json, and just a glance at its cousin package-lock.jsonwebpack.config.jsindex.htmlsrc/main.jssrc/App.vue
A brief explanation of each of the files and directories shown in the tree diagram are given below:
README.md creating the project scaffolding .node_modules/ package.json file.package.json webpack-simple template, and contains information about the npm packages (including with their versions and other details) that must be installed. Take a hard look at the content of this file — this is where you should visit and perhaps edit to add/delete packages necessary for the project, and then run npm install. Read more about package.json here .package-lock.json webpack.config.js here ).index.html src/main.js src/App.vue .vue file, i.e. App.vue, as our only component. But shortly we will add more components to our project (primarily following the structure of the dashboard), and link them in accordance to our desired hierarchy, with App.vue being the ancestor of all. These .vue files will contain code in a format that Vue wants us to write. Don’t worry, they are JavaScript code written maintaining a structure that can keep us sane and organized. You have been warned — by the end of this project, if you are new to Vue, you may get addicted to the template — script — style way of organizing code!
Now that we have created the foundation, it’s time to:
Modify the templates and tweak the configuration files a bit, so that the project behaves just the way we want.
Create new .vue files, and implement the dashboard structure with Vue code.
We will learn them in the next section, which is going to be a bit long and demands some attention. If you need caffeine or water, or want to discharge — now is the time!?
3. Customizing The Default Project Structure
It’s time to tinker with the foundation that the scaffolded project has given us. Before you start, ensure that the development server provided by webpack is running. The advantage of running this server continuously is that any changes you make in the source code — one you save it and refresh the web page — it gets immediately reflected on the browser.
If you want to start the development server, just execute the following command from the terminal (assuming your current directory is the project directory):
npm run dev
In the following sections, we will modify some of the existing files, and add some new files.
Modify Existing Files
index.html
Our application is literally a single page application, because there is just one webpage that gets displayed on the browser. We will talk about this later, but first let’s just make our first change — altering the text within the </code> tag.</p>
<p>With this small revision, the HTML file looks like the following:</p>
<pre><code><!DOCTYPE html>
<html lang="en">
<head>
<meta charset="utf-8">
<!-- Modify the text of the title tag below -->
<title>Vue Weather Dashboard</title>
</head>
<body>
<div id="app"></div>
<script src="/dist/build.js"></script>
</body>
</html>
</code></pre>
<p>Take a moment to refresh the webpage at <code>localhost:8080</code>, and see the change reflected on the title bar of the tab on the browser — it should say “Vue Weather Dashboard”. However, this was just to demonstrate you the process of making changes and verifying if it’s working. We have more things to do!</p>
<p>This simple HTML page lacks many things that we want in our project, especially the following:</p>
<ul>
<li>Some meta information</li>
<li>CDN links to Bootstrap (CSS framework)</li>
<li>link to custom stylesheet (yet to be added in the project)</li>
<li>Pointers to the Google Maps Geolocation API from <code></code> tag</li>
</ul>
<p>After adding those things, the final <code>index.html</code> has the following content:</p>
<div>
<pre><code><!DOCTYPE html>
<html lang="en">
<head>
<meta http-equiv="Content-Type" content="text/html;charset=utf-8" />
<meta http-equiv="X-UA-Compatible" content="IE=edge">
<meta name="viewport" content="width=device-width, initial-scale=1, shrink-to-fit=no">
<link rel="stylesheet" href="//maxcdn.bootstrapcdn.com/bootstrap/4.0.0/css/bootstrap.min.css">
<link rel="stylesheet" type="text/css" href="src/css/style.css">
<title>Weather Dashboard</title>
<script src="https://maps.googleapis.com/maps/api/js?key=AIzaSyC-lCjpg1xbw-nsCc11Si8Ldg2LKYizqI4&libraries=places"></script>
</head>
<body>
<div id="app"></div>
<script src="/dist/build.js"></script>
</body>
</html>
</code></pre>
</div>
<p>Save the file, and refresh the webpage. You might have noticed a slight bump while the page was getting loaded — it is primarily due to the fact that the page style is now being controlled by Bootstrap, and the style elements like fonts, spacing, etc. are different from the default we had earlier (if you are not sure, roll back to the default and see the difference).</p>
<figure><a target="_blank" href="https://cloud.netlifyusercontent.com/assets/344dbf88-fdf9-42bb-adb4-46f01eedd629/d68802b5-8099-46e5-a89c-87da85634584/interactive-weather-dashboard-image5.png"><br />
<img decoding="async" src="https://res.cloudinary.com/indysigner/image/fetch/f_auto,q_auto/w_400/https://cloud.netlifyusercontent.com/assets/344dbf88-fdf9-42bb-adb4-46f01eedd629/d68802b5-8099-46e5-a89c-87da85634584/interactive-weather-dashboard-image5.png" alt="A screenshot when you refresh the webpage with localhost:8080"></a><figcaption>
(<a target="_blank" href="https://cloud.netlifyusercontent.com/assets/344dbf88-fdf9-42bb-adb4-46f01eedd629/d68802b5-8099-46e5-a89c-87da85634584/interactive-weather-dashboard-image5.png">Large preview</a>)<br />
</figcaption></figure>
<p><strong>Note</strong>: <em>One important thing before we move on — the URL for the Google Maps API contains a key which is a property of FusionCharts. For now, you can use this key to build the project, as we don’t want you to get bogged down by these type of minute details (which can be distractions while you are new). However, we strongly urge you to <a target="_blank" href="https://developers.google.com/maps/documentation/javascript/get-api-key">generate and use your own Google Maps API key</a> once you have made some progress and feel comfortable to pay attention to these tiny details.</em></p>
<h5>package.json</h5>
<p>At the time of writing this, we used certain versions of the npm packages for our project, and we know for sure that those things work together. However, by the time you are executing the project, it is very much possible that the latest stable versions of the packages that npm downloads for you are not the same as we used, and this might break the code (or do things that are beyond our control). Thus, it is very important to have the exact same <code>package.json</code> file that was used to build this project, so that our code/explanations and the results you get are consistent.</p>
<p>The content of the <code>package.json</code> file should be:</p>
<div>
<pre><code>{
"name": "vue_weather_dashboard",
"description": "A Vue.js project",
"version": "1.0.0",
"author": "FusionCharts",
"license": "MIT",
"private": true,
"scripts": {
"dev": "cross-env NODE_ENV=development webpack-dev-server --open --hot",
"build": "cross-env NODE_ENV=production webpack --progress --hide-modules"
},
"dependencies": {
"axios": "^0.18.0",
"babel": "^6.23.0",
"babel-cli": "^6.26.0",
"babel-polyfill": "^6.26.0",
"fusioncharts": "^3.13.3",
"moment": "^2.22.2",
"moment-timezone": "^0.5.21",
"vue": "^2.5.11",
"vue-fusioncharts": "^2.0.4"
},
"browserslist": [
"> 1%",
"last 2 versions",
"not ie </code></pre>
</div>
<p>We encourage you to go through the new <code>package.json</code>, and figure out what are functions of different objects in the json. You may prefer changing the value of the “<code>author</code>” key to your name. Also, the packages mentioned in the dependencies will reveal themselves at the right time in the code. For the time being, it’s sufficient to know that:</p>
<ul>
<li><code>babel</code>-related packages are for properly handling the ES6 style code by the browser;</li>
<li><code>axios</code> deals with <a target="_blank" href="https://developer.mozilla.org/en-US/docs/Web/JavaScript/Reference/Global_Objects/Promise">Promise</a>-based HTTP requests;</li>
<li><code>moment</code> and moment-timezone are for date/time manipulation;</li>
<li><code>fusioncharts</code> and <code>vue-fusioncharts</code> are responsible for rendering charts:</li>
<li><code>vue</code>, for obvious reasons.</li>
</ul>
<h5>webpack.config.js</h5>
<p>As with <code>package.json</code>, we suggest you to maintain a <code>webpack.config.js</code> file that is consistent with the one we used for building the project. However, before making any changes, we recommend you to carefully compare the default code in the <code>webpack.config.js</code>, and the code we have provided below. You will notice quite a few differences — google them and have a basic idea of what they mean. Since explaining webpack configurations in depth is out of the scope of this article, you are on your own in this regard.</p>
<p>The customized <code>webpack.config.js</code> file is as follows:</p>
<div>
<pre><code>var path = require('path')
var webpack = require('webpack')
module.exports = {
entry: ['babel-polyfill', './src/main.js'],
output: {
path: path.resolve(__dirname, './dist'),
publicPath: '/dist/',
filename: 'build.js'
},
module: {
rules: [
{
test: /.css$/,
use: [
'vue-style-loader',
'css-loader'
],
}, {
test: /.vue$/,
loader: 'vue-loader',
options: {
loaders: {
}
// other vue-loader options go here
}
},
{
test: /.js$/,
loader: 'babel-loader',
exclude: /node_modules/
},
{
test: /.(png|jpg|gif|svg)$/,
loader: 'file-loader',
options: {
name: '[name].[ext]?[hash]'
}
}
]
},
resolve: {
alias: {
'vue$': 'vue/dist/vue.esm.js'
},
extensions: ['*', '.js', '.vue', '.json']
},
devServer: {
historyApiFallback: true,
noInfo: true,
overlay: true,
host: '0.0.0.0',
port: 8080
},
performance: {
hints: false
},
devtool: '#eval-source-map'
}
if (process.env.NODE_ENV === 'production') {
module.exports.devtool = '#source-map'
// http://vue-loader.vuejs.org/en/workflow/production.html
module.exports.plugins = (module.exports.plugins || []).concat([
new webpack.DefinePlugin({
'process.env': {
NODE_ENV: '"production"'
}
}),
new webpack.optimize.UglifyJsPlugin({
sourceMap: true,
compress: {
warnings: false
}
}),
new webpack.LoaderOptionsPlugin({
minimize: true
})
])
}
</code></pre>
</div>
<p>With changes made to the project’s <code>webpack.config.js</code>, it’s imperative that you stop the development server which is running (<kbd>Ctrl</kbd> + <kbd>C</kbd>), and restart it with the following command executed from the project’s directory after installing all the packages mentioned in the <code>package.json</code> file:</p>
<pre><code>npm install
npm run dev
</code></pre>
<p>With this, the ordeal of tweaking the configurations and ensuring that the right packages are in place ends. However, this also marks the journey of modifying and writing code, which is a bit long but also very rewarding!</p>
<h5>src/main.js</h5>
<p>This file is the key to top-level orchestration of the project — it is here that we define:</p>
<ul>
<li>What the top level dependencies are (where to get the most important npm packages necessary);</li>
<li>How to resolve the dependencies, along with instructions to Vue on using plugins/wrappers, if any;</li>
<li>A Vue instance that manages the topmost component in the project: <code>src/App.vue</code> (the nodal <code>.vue</code> file).</li>
</ul>
<p>In line with our goals for the <code>src/main.js</code> file, the code should be:</p>
<div>
<pre><code>// Import the dependencies and necessary modules
import Vue from 'vue';
import App from './App.vue';
import FusionCharts from 'fusioncharts';
import Charts from 'fusioncharts/fusioncharts.charts';
import Widgets from 'fusioncharts/fusioncharts.widgets';
import PowerCharts from 'fusioncharts/fusioncharts.powercharts';
import FusionTheme from 'fusioncharts/themes/fusioncharts.theme.fusion';
import VueFusionCharts from 'vue-fusioncharts';
// Resolve the dependencies
Charts(FusionCharts);
PowerCharts(FusionCharts);
Widgets(FusionCharts);
FusionTheme(FusionCharts);
// Globally register the components for project-wide use
Vue.use(VueFusionCharts, FusionCharts);
// Instantiate the Vue instance that controls the application
new Vue({
el: '#app',
render: h => h(App)
})
</code></pre>
</div>
<h5>src/App.vue</h5>
<p>This is one of the most important files in the entire project, and represents the topmost component in the hierarchy — the entire application itself, as a whole. For our project, this component will do all the heavy lifting, which we will explore later. For now, we want to get rid of the default boilerplate, and put something of our own.</p>
<p>If you are new to Vue’s way of organizing code, it would be better to get an idea of the general structure within the <code>.vue</code> files. The <code>.vue</code> files comprises of three sections:</p>
<ul>
<li><strong>Template</strong><br />
This is where the HTML template for the page is defined. Apart from the static HTML, this section also contains Vue’s way of embedding dynamic content, using the double curly braces <code>{{ }}</code>.</li>
<li><strong>Script</strong><br />
JavaScript rules this section, and is responsible for generating dynamic content that goes and sits within the HTML template at appropriate places. This section is primarily an object that is exported, and consists of:</p>
<ul>
<li><strong>Data</strong><br />
This is a function itself, and usually it returns some desired data encapsulated within a nice data structure.</li>
<li><strong>Methods</strong><br />
An object that consists of one or more functions/methods, each of which usually manipulates data in some way or the other, and also controls the dynamic content of the HTML template.</li>
<li><strong>Computed</strong><br />
Much like the method object discussed above with one important distinction — while all the functions within the method object are executed whenever any one of them is called, the functions within the computed object behaves much more sensibly, and executes if and only if it has been called.</li>
</ul>
</li>
<li><strong>Style</strong><br />
This section is for CSS styling that applies to the HTML of the page (written within template) — put the good old CSS here to make your pages beautiful!</li>
</ul>
<p>Keeping the above paradigm in mind, let’s minimally customize the code in <code>App.vue</code>:</p>
<pre><code><template>
<div id="app">
<p>This component's code is in {{ filename }}</p>
</div>
</template>
<script>
export default {
data() {
return {
filename: 'App.vue'
}
},
methods: {
},
computed: {
},
}
</script>
<style>
</style>
</code></pre>
<p>Remember that the above code snippet is simply for testing out that <code>App.vue</code> is working with our own code in it. It will later go on through a lot of changes, but first save the file and refresh the page on the browser.</p>
<figure><a target="_blank" href="https://cloud.netlifyusercontent.com/assets/344dbf88-fdf9-42bb-adb4-46f01eedd629/3ae50e3f-da4c-40ee-b9a4-48d2ac8ebd98/interactive-weather-dashboard-image7.png"><br />
<img decoding="async" src="https://res.cloudinary.com/indysigner/image/fetch/f_auto,q_auto/w_400/https://cloud.netlifyusercontent.com/assets/344dbf88-fdf9-42bb-adb4-46f01eedd629/3ae50e3f-da4c-40ee-b9a4-48d2ac8ebd98/interactive-weather-dashboard-image7.png" alt="A screenshot of the browser with the message “This component's code is in App.vue”"></a><figcaption>
(<a target="_blank" href="https://cloud.netlifyusercontent.com/assets/344dbf88-fdf9-42bb-adb4-46f01eedd629/3ae50e3f-da4c-40ee-b9a4-48d2ac8ebd98/interactive-weather-dashboard-image7.png">Large preview</a>)<br />
</figcaption></figure>
<p>At this point, it’s probably a good idea to get some help in tooling. Check out the <a target="_blank" href="https://chrome.google.com/webstore/detail/vuejs-devtools/nhdogjmejiglipccpnnnanhbledajbpd?hl=en">Vue devtools for Chrome</a>, and if you don’t have much problems in using Google Chrome as your default browser for development, install the tool and play around with it a bit. It will come in extremely handy for further development and debugging, when things becomes more complicated.</p>
<h4>Additional Directories And Files</h4>
<p>The next step would be to add additional files, so that the structure of our project becomes complete. We would add the following directories and files:</p>
<ul>
<li><code>src/css/</code><br />
— <code>style.css</code></li>
<li><code>src/assets/</code><br />
— <a target="_blank" href="https://raw.githubusercontent.com/datasouvik/modified_weather_dashboard/master/src/assets/calendar.svg"><code>calendar.svg</code></a><br />
— <a target="_blank" href="https://raw.githubusercontent.com/datasouvik/modified_weather_dashboard/master/src/assets/location.svg"><code>vlocation.svg</code></a><br />
— <a target="_blank" href="https://raw.githubusercontent.com/datasouvik/modified_weather_dashboard/master/src/assets/search.svg"><code>search.svg</code></a><br />
— <a target="_blank" href="https://raw.githubusercontent.com/datasouvik/modified_weather_dashboard/master/src/assets/winddirection.svg"><code>winddirection.svg</code></a><br />
— <a target="_blank" href="https://raw.githubusercontent.com/datasouvik/modified_weather_dashboard/master/src/assets/windspeed.svg"><code>windspeed.svg</code></a></li>
<li><code>src/components/</code><br />
— <code>Content.vue</code><br />
— <code>Highlights.vue</code><br />
— <code>TempVarChart.vue</code><br />
— <code>UVIndex.vue</code><br />
— <code>Visibility.vue</code><br />
— <code>WindStatus.vue</code></li>
</ul>
<p><strong>Note</strong>: <em>Save the hyperlinked <code>.svg</code> files in your project.</em></p>
<p>Create the directories and files mentioned above. The final project structure should like look (remember to delete folders and files from the default structure that are now unnecessary):</p>
<pre><code>vue_weather_dashboard/
|--- README.md
|--- node_modules/
| |--- ...
| |--- ...
| |--- [many npm packages we installed]
| |--- ...
| |--- ...
|--- package.json
|--- package-lock.json
|--- webpack.config.js
|--- index.html
|--- src/
| |--- App.vue
| |--- css/
| | |--- style.css
| |--- assets/
| | |--- calendar.svg
| | |--- location.svg
| | |--- location.svg
| | |--- winddirection.svg
| | |--- windspeed.svg
| |--- main.js
| |--- components/
| | |--- Content.vue
| | |--- Highlights.vue
| | |--- TempVarChart.vue
| | |--- UVIndex.vue
| | |--- Visibility.vue
| | |--- WindStatus.vue
</code></pre>
<p><em>There might be some other files, like</em> <code>.babelrc</code>, <code>.gitignore</code>, <code>.editorconfig</code>, <em>etc. in the project’s root folder. You may ignore them safely for now.</em></p>
<p>In the following section, we will add minimal content to the newly added files, and test whether they are properly working.</p>
<h5>src/css/style.css</h5>
<p>Although it will not be of much use immediately, copy the following code to the file:</p>
<div>
<pre><code>@import url("https://fonts.googleapis.com/css?family=Roboto:300,400,500");
:root {
font-size: 62.5%;
}
body {
font-family: Roboto;
font-weight: 400;
width: 100%;
margin: 0;
font-size: 1.6rem;
}
#sidebar {
position: relative;
display: flex;
flex-direction: column;
background-image: linear-gradient(-180deg, #80b6db 0%, #7da7e2 100%);
}
#search {
text-align: center;
height: 20vh;
position: relative;
}
#location-input {
height: 42px;
width: 100%;
opacity: 1;
border: 0;
border-radius: 2px;
background-color: rgba(255, 255, 255, 0.2);
margin-top: 16px;
padding-left: 16px;
color: #ffffff;
font-size: 1.8rem;
line-height: 21px;
}
#location-input:focus {
outline: none;
}
::placeholder {
color: #FFFFFF;
opacity: 0.6;
}
#current-weather {
color: #ffffff;
font-size: 8rem;
line-height: 106px;
position: relative;
}
#current-weather>span {
color: #ffffff;
font-size: 3.6rem;
line-height: 42px;
vertical-align: super;
opacity: 0.8;
top: 15px;
position: absolute;
}
#weather-desc {
font-size: 2.0rem;
color: #ffffff;
font-weight: 500;
line-height: 24px;
}
#possibility {
color: #ffffff;
font-size: 16px;
font-weight: 500;
line-height: 19px;
}
#max-detail,
#min-detail {
color: #ffffff;
font-size: 2.0rem;
font-weight: 500;
line-height: 24px;
}
#max-detail>i,
#min-detail>i {
font-style: normal;
height: 13.27px;
width: 16.5px;
opacity: 0.4;
}
#max-detail>span,
#min-detail>span {
color: #ffffff;
font-family: Roboto;
font-size: 1.2rem;
line-height: 10px;
vertical-align: super;
}
#max-summary,
#min-summary {
opacity: 0.9;
color: #ffffff;
font-size: 1.4rem;
line-height: 16px;
margin-top: 2px;
opacity: 0.7;
}
#search-btn {
position: absolute;
right: 0;
top: 16px;
padding: 2px;
z-index: 999;
height: 42px;
width: 45px;
background-color: rgba(255, 255, 255, 0.2);
border: none;
}
#dashboard-content {
text-align: center;
height: 100vh;
}
#date-desc,
#location-desc {
color: #ffffff;
font-size: 1.6rem;
font-weight: 500;
line-height: 19px;
margin-bottom: 15px;
}
#date-desc>img {
top: -3px;
position: relative;
margin-right: 10px;
}
#location-desc>img {
top: -3px;
position: relative;
margin-left: 5px;
margin-right: 15px;
}
#location-detail {
opacity: 0.7;
color: #ffffff;
font-size: 1.4rem;
line-height: 20px;
margin-left: 35px;
}
.centered {
position: fixed;
top: 45%;
left: 50%;
transform: translate(-50%, -50%);
}
.max-desc {
width: 80px;
float: left;
margin-right: 28px;
}
.temp-max-min {
margin-top: 40px
}
#dashboard-content {
background-color: #F7F7F7;
}
.custom-card {
background-color: #FFFFFF !important;
border: 0 !important;
margin-top: 16px !important;
margin-bottom: 20px !important;
}
.custom-content-card {
background-color: #FFFFFF !important;
border: 0 !important;
margin-top: 16px !important;
margin-bottom: 0px !important;
}
.header-card {
height: 50vh;
}
.content-card {
height: 43vh;
}
.card-divider {
margin-top: 0;
}
.content-header {
color: #8786A4;
font-size: 1.4rem;
line-height: 16px;
font-weight: 500;
padding: 15px 10px 5px 15px;
}
.highlights-item {
min-height: 37vh;
max-height: 38vh;
background-color: #FFFFFF;
}
.card-heading {
color: rgb(33, 34, 68);
font-size: 1.8rem;
font-weight: 500;
line-height: 21px;
text-align: center;
}
.card-sub-heading {
color: #73748C;
font-size: 1.6rem;
line-height: 19px;
}
.card-value {
color: #000000;
font-size: 1.8rem;
line-height: 21px;
}
span text {
font-weight: 500 !important;
}
hr {
padding-top: 1.5px;
padding-bottom: 1px;
margin-bottom: 0;
margin-top: 0;
line-height: 0.5px;
}
@media only screen and (min-width: 768px) {
#sidebar {
height: 100vh;
}
#info {
position: fixed;
bottom: 50px;
width: 100%;
padding-left: 15px;
}
.wrapper-right {
margin-top: 80px;
}
}
@media only screen and (min-width:1440px) {
#sidebar {
width: 350px;
max-width: 350px;
flex: auto;
}
#dashboard-content {
width: calc(100% — 350px);
max-width: calc(100% — 350px);
flex: auto;
}
}
</code></pre>
</div>
<h5>src/assets/</h5>
<p>In this directory, download and save the <code>.svg</code> files mentioned below:</p>
<ul>
<li><a target="_blank" href="https://raw.githubusercontent.com/datasouvik/modified_weather_dashboard/master/src/assets/calendar.svg"><code>calendar.svg</code></a></li>
<li><a target="_blank" href="https://raw.githubusercontent.com/datasouvik/modified_weather_dashboard/master/src/assets/location.svg"><code>location.svg</code></a></li>
<li><a target="_blank" href="https://raw.githubusercontent.com/datasouvik/modified_weather_dashboard/master/src/assets/search.svg"><code>search.svg</code></a></li>
<li><a target="_blank" href="https://raw.githubusercontent.com/datasouvik/modified_weather_dashboard/master/src/assets/winddirection.svg"><code>winddirection.svg</code></a></li>
<li><a target="_blank" href="https://raw.githubusercontent.com/datasouvik/modified_weather_dashboard/master/src/assets/windspeed.svg"><code>windspeed.svg</code></a></li>
</ul>
<h5>src/components/Content.vue</h5>
<p>This is what we call a dumb component — a placeholder, that is there just to maintain the hierarchy, and essentially passes on data to its child components.</p>
<p>Remember that there is no technical bar for writing all our code in the <code>App.vue</code> file, but we take the approach of splitting up the code by nesting the components for two reasons:</p>
<ul>
<li>To write clean code, which aids readability and maintainability;</li>
<li>To replicate the same structure that we will see on screen, i.e., the hierarchy.</li>
</ul>
<p>Before we nest the component defined in <code>Content.vue</code> within the root component <code>App.vue</code>, let’s write some toy (but educational) code for <code>Content.vue</code>:</p>
<div>
<pre><code><template>
<div>
<p>This child components of Content.vue are:</p>
<ul>
<li v-for="child in childComponents">{{ child }}</li>
</ul>
</div>
</template>
<script>
export default {
data () {
return {
childComponents: ['TempVarChart.vue', 'Highlights.vue']
}
},
methods: {
},
computed: {
},
}
</script>
<style>
</style>
</code></pre>
</div>
<p>In the code, carefully observe and understand the following:</p>
<ul>
<li>Within the <code></code> tag (where we obviously write some JavaScript code), we define an object that is exported (made available to other files) by default. This object contains a function <code>data()</code>, that returns an array object called <code>childComponents</code>, with its elements being names of the component files that should be nested further.</li>
<li>Within the <code></code> tag (where we write some HTML template), the thing of interest is the <code>
<ul></code>.</p>
<ul>
<li>Within the unordered list, each list item should be names of the intended child components, as defined in the array object <code>childComponents</code>. Moreover, the list should automatically extend till the last element of the array. Seems like we should write a <code>for</code>-loop, isn’t it? We do that by using the <code>v-for</code> directive provided by Vue.js. The <code>v-for</code> directive:
<ul>
<li>Acts as an attribute of the <code>
<li></code> tag, iterates through the array, renders the names of the child components where the iterator is mentioned within the <code>{{ }}</code> brackets (where we write the text for the list items).</li>
</ul>
</li>
</ul>
</li>
</ul>
<p>The code and the explanation above forms the basis of your subsequent understanding of how the script and the template are interrelated, and how we can use the directives provided by Vue.js.</p>
<p>We have learnt quite a lot, but even after all these, we have one thing left to learn about seamlessly connecting components in hierarchy — passing data down from the parent component to its children. For now, we need to learn how to pass some data from <code>src/App.vue</code> to <code>src/components/Content.vue</code>, so that we can use the same techniques for the rest of the component nesting in this project.</p>
<p>Data trickling down from the parent to the child components might sound simple, but the devil is in the details! As briefly explained below, there are multiple steps involved in making it work:</p>
<ul>
<li><strong>Defining and the data</strong><br />
For now, we want some static data to play with — an object containing hard-coded values about different aspects of weather will just be fine! We create an object called <code>weather_data</code> and return it from the <code>data()</code> function of <code>App.vue</code>. The <code>weather_data</code> object is given in the snippet below:</li>
</ul>
<pre><code>weather_data: {
location: "California",
temperature: {
current: "35 C",
},
highlights: {
uvindex: "3",
windstatus: {
speed: "20 km/h",
direction: "N-E",
},
visibility: "12 km",
},
},
</code></pre>
<ul>
<li><strong>Passing the data from the parent</strong><br />
To pass the data, we need a destination where we want to send the data! In this case, the destination is the <code>Content.vue</code> component, and the way to implement it is to:</p>
<ul>
<li>Assign the <code>weather_data</code> object to a <em>custom attribute</em> of the <code></code> tag</li>
<li>Bind the attribute with the data using the <code>v-bind</code>: directive provided by Vue.js, which makes the attribute value dynamic (responsive to changes made in the original data).
<pre><code><Content v-bind:weather_data=“weather_data”></Content>
</code></pre>
</li>
</ul>
</li>
</ul>
<p>Defining and passing the data is handled at the source side of the handshake, which in our case is the <code>App.vue</code> file.</p>
<p>The code for the <code>App.vue</code> file, at its current status, is given below:</p>
<pre><code><template>
<div id="app">
<p>This component's code is in {{ filename }}</p>
<Content v-bind:weather_data="weather_data"></Content>
</div>
</template>
<script>
import Content from './components/Content.vue'
export default {
name: 'app',
components: {
'Content': Content
},
data () {
return {
filename: 'App.vue',
weather_data: {
location: "California",
temperature: {
current: "35 C",
},
highlights: {
uvindex: "3",
windstatus: {
speed: "20 km/h",
direction: "N-E",
},
visibility: "12 km",
},
},
}
},
methods: {
},
computed: {
},
}
</script>
<style>
</style>
</code></pre>
<figure><a target="_blank" href="https://cloud.netlifyusercontent.com/assets/344dbf88-fdf9-42bb-adb4-46f01eedd629/0c7c18e0-caba-4cb0-b3c3-79e5ee34a62f/interactive-weather-dashboard-image6.png"><br />
<img decoding="async" src="https://res.cloudinary.com/indysigner/image/fetch/f_auto,q_auto/w_400/https://cloud.netlifyusercontent.com/assets/344dbf88-fdf9-42bb-adb4-46f01eedd629/0c7c18e0-caba-4cb0-b3c3-79e5ee34a62f/interactive-weather-dashboard-image6.png" alt="A screenshot of the browser with the message “This component's code is in App.vue. This child components of Content.vue are: TempVarChart.vue, Highlights.vue”"></a><figcaption>
(<a target="_blank" href="https://cloud.netlifyusercontent.com/assets/344dbf88-fdf9-42bb-adb4-46f01eedd629/0c7c18e0-caba-4cb0-b3c3-79e5ee34a62f/interactive-weather-dashboard-image6.png">Large preview</a>)<br />
</figcaption></figure>
<p>With the data defined and passed from the source (parent component), it is now the child’s responsibility to receive the data and render it appropriately, as explained in the next two steps.</p>
<ul>
<li><strong>Receiving the data by the child</strong><br />
The child component, in this case <code>Content.vue</code>, must receive the <code>weather_data</code> object send to it by the parent component <code>App.vue</code>. Vue.js provides a mechanism to do so — all you need is an array object called <a target="_blank" href="https://vuejs.org/v2/guide/components-props.html"><code>props</code></a>, defined in the default object exported by <code>Content.vue</code>. Each element of the array <code>props</code> is a name of the data objects it wants to receive from its parent. For now, the only data object that it is supposed to receive is <code>weather_data</code> from App.vue. Thus, the <code>props</code> array looks like:</li>
</ul>
<pre><code><template>
// HTML template code here
</template>
<script>
export default {
props: ["weather_data"],
data () {
return {
// data here
}
},
}
</script>
<style>
// component specific CSS here
</style>
</code></pre>
<ul>
<li><strong>Rendering the data in the page</strong><br />
Now that we have ensured receiving the data, the last task we need to complete is to render the data. For this example, we will directly dump the received data on the web page, just to illustrate the technique. However, in real applications (like the one we are about to build), data normally goes through lots of processing, and only the relevant parts of it are displayed in ways that suits the purpose. For example, in this project we will eventually get raw data from the weather API, clean and format it, feed the data to the data structures necessary for the charts, and then visualize it. Anyway, to display the raw data dump, we will just use the <code>{{ }}</code> brackets that Vue understands, as shown in the snippet below:</li>
</ul>
<pre><code><template>
<div id="pagecontent">
// other template code here
{{ weather_data }}
</div>
</template>
</code></pre>
<p>It’s now time to assimilate all the bits and pieces. The code for <code>Content.vue</code> — at its current status — is given below:</p>
<div>
<pre><code><template>
<div id="pagecontent">
<p>This child components of Content.vue are:</p>
<ul>
<li v-for="child in childComponents">{{ child }}</li>
</ul>
{{ weather_data }}
</div>
</template>
<script>
export default {
props: ["weather_data"],
data () {
return {
childComponents: ['TempVarChart.vue', 'Highlights.vue']
}
},
methods: {
},
computed: {
},
}
</script>
<style>
#pagecontent {
border: 1px solid black;
padding: 2px;
}
</style>
</code></pre>
</div>
<figure><a target="_blank" href="https://cloud.netlifyusercontent.com/assets/344dbf88-fdf9-42bb-adb4-46f01eedd629/ec620211-f991-4ce3-9731-710ba32fa3b4/interactive-weather-dashboard-image9.png"><br />
<img decoding="async" src="https://res.cloudinary.com/indysigner/image/fetch/f_auto,q_auto/w_400/https://cloud.netlifyusercontent.com/assets/344dbf88-fdf9-42bb-adb4-46f01eedd629/ec620211-f991-4ce3-9731-710ba32fa3b4/interactive-weather-dashboard-image9.png" alt="A screenshot of the browser with the result of the code provided"></a><figcaption>
(<a target="_blank" href="https://cloud.netlifyusercontent.com/assets/344dbf88-fdf9-42bb-adb4-46f01eedd629/ec620211-f991-4ce3-9731-710ba32fa3b4/interactive-weather-dashboard-image9.png">Large preview</a>)<br />
</figcaption></figure>
<p>After making the changes discussed above, refresh the webpage on the browser and see how it looks. Take a moment to appreciate the complexity that Vue handles — if you modify the <code>weather_data</code> object in <code>App.vue</code>, it gets silently conveyed to <code>Content.vue</code>, and eventually to the browser displaying the webpage! Try by changing the value for the key location.</p>
<p>Although we have learned about props and data binding using static data, we will be using dynamic data collected using web APIs in the application, and will <em>change the code accordingly</em>.</p>
<h4>Summary</h4>
<p>Before we move on to the rest of the <code>.vue</code> files, let’s summarize what we have learnt while we wrote the code for <code>App.vue</code> and <code>components/Content.vue</code>:</p>
<ul>
<li>The <code>App.vue</code> file is what we call the root component — the one that sits at the top of the component hierarchy. The rest of the <code>.vue</code> files represents components that are its direct child, grandchild, and so on.</li>
<li>The <code>Content.vue</code> file is a dummy component — its responsibility is to pass on the data to levels below and maintain the structural hierarchy, so that our code remains consistent with the philosophy “*what we see is what we implement*”.</li>
<li>The parent-child relationship of component does not happen out of thin air — you must <em>register a component</em> (either globally or locally, depending on the intended usage of the component), and then <em>nest</em> it using custom HTML tags (whose spellings are the exact same as that of the names with which the components has been registered).</li>
<li>Once registered and nested, data is passed on from parent to child components, and the flow is <em>never reverse</em> (bad things will happen if the project architecture allows backflow). The parent component is the relative source of the data, and it passes down relevant data to its children using the <code>v-bind</code> directive for the attributes of the custom HTML elements. The child receives the data intended for it using props, and then decides on its own what to do with the data.</li>
</ul>
<p>For the rest of the components, we will not indulge in detailed explanation — we will just write the code based on the learnings from the above summary. The code will be self-evident, and if you get confused about the hierarchy, refer to the diagram below:</p>
<figure><a target="_blank" href="https://cloud.netlifyusercontent.com/assets/344dbf88-fdf9-42bb-adb4-46f01eedd629/d907827c-a9e0-4abc-a891-274cc701965f/interactive-weather-dashboard-image8.png"><br />
<img decoding="async" src="https://res.cloudinary.com/indysigner/image/fetch/f_auto,q_auto/w_400/https://cloud.netlifyusercontent.com/assets/344dbf88-fdf9-42bb-adb4-46f01eedd629/d907827c-a9e0-4abc-a891-274cc701965f/interactive-weather-dashboard-image8.png" alt="A diagram explaining the hierarchy of the code"></a><figcaption>
(<a target="_blank" href="https://cloud.netlifyusercontent.com/assets/344dbf88-fdf9-42bb-adb4-46f01eedd629/d907827c-a9e0-4abc-a891-274cc701965f/interactive-weather-dashboard-image8.png">Large preview</a>)<br />
</figcaption></figure>
<p>The diagram says that <code>TempVarChart.vue</code> and <code>Highlights.vue</code> are the direct child of <code>Content.vue</code>. Thus, it might be a good idea to prepare <code>Content.vue</code> for sending data to those components, which we do using the code below:</p>
<div>
<pre><code><template>
<div id="pagecontent">
<p>This child components of Content.vue are:</p>
<ul>
<li v-for="child in childComponents">{{ child }}</li>
</ul>
{{ weather_data }}
<temp-var-chart :tempVar="tempVar"></temp-var-chart>
<today-highlights :highlights="highlights"></today-highlights>
</div>
</template>
<script>
import TempVarChart from './TempVarChart.vue'
import Highlights from './Highlights.vue'
export default {
props: ["weather_data"],
components: {
'temp-var-chart': TempVarChart,
'today-highlights': Highlights
},
data () {
return {
childComponents: ['TempVarChart.vue', 'Highlights.vue'],
tempVar: this.weather_data.temperature,
highlights: this.weather_data.highlights,
}
},
methods: {
},
computed: {
},
}
</script>
<style>
</style>
</code></pre>
</div>
<p>Once you save this code, you will get errors — don’t worry, it is expected. It will be fixed once you have the rest of the component files ready. If it bothers you not to be able to see the output, comment out the lines containing the custom element tags <code></code> and <code></code>.</p>
<p>For this section, this is the final code of <code>Content.vue</code>. For the rest of this section, <em>we will reference to this code</em>, and not the previous ones that we wrote for learning.</p>
<h5>src/components/TempVarChart.vue</h5>
<p>With its parent component <code>Content.vue</code> passing on the data, <code>TempVarChart.vue</code> must be set up to receive and render the data, as shown in the code below:</p>
<pre><code><template>
<div id="tempvarchart">
<p>Temperature Information:</p>
{{ tempVar }}
</div>
</template>
<script>
export default {
props: ["tempVar"],
data () {
return {
}
},
methods: {
},
computed: {
},
}
</script>
<style>
</style>
</code></pre>
<h5>src/components/Highlights.vue</h5>
<p>This component will also receive data from <code>App.vue</code> — its parent component. After that, it should be linked with its child components, and relevant data should be passed on to them.</p>
<p>Let’s first see the code for receiving data from the parent:</p>
<pre><code><template>
<div id="highlights">
<p>Weather Highlights:</p>
{{ highlights }}
</div>
</template>
<script>
export default {
props: ["highlights"],
data () {
return {
}
},
methods: {
},
computed: {
},
}
</script>
<style>
</style>
</code></pre>
<p>At this point, the web page looks like the image below:</p>
<figure><a target="_blank" href="https://cloud.netlifyusercontent.com/assets/344dbf88-fdf9-42bb-adb4-46f01eedd629/b8418772-369a-43ba-a5b5-c781f4fcd697/interactive-weather-dashboard-image10.png"><br />
<img decoding="async" src="https://res.cloudinary.com/indysigner/image/fetch/f_auto,q_auto/w_400/https://cloud.netlifyusercontent.com/assets/344dbf88-fdf9-42bb-adb4-46f01eedd629/b8418772-369a-43ba-a5b5-c781f4fcd697/interactive-weather-dashboard-image10.png" alt="Result of the code displayed in the browser"></a><figcaption>
(<a target="_blank" href="https://cloud.netlifyusercontent.com/assets/344dbf88-fdf9-42bb-adb4-46f01eedd629/b8418772-369a-43ba-a5b5-c781f4fcd697/interactive-weather-dashboard-image10.png">Large preview</a>)<br />
</figcaption></figure>
<p>Now we need to modify the code of <code>Highlights.vue</code> to register and nest its child components, followed by passing the data to children. The code for it is as follows:</p>
<pre><code><template>
<div id="highlights">
<p>Weather Highlights:</p>
{{ highlights }}
<uv-index :highlights="highlights"></uv-index>
<visibility :highlights="highlights"></visibility>
<wind-status :highlights="highlights"></wind-status>
</div>
</template>
<script>
import UVIndex from './UVIndex.vue';
import Visibility from './Visibility.vue';
import WindStatus from './WindStatus.vue';
export default {
props: ["highlights"],
components: {
'uv-index': UVIndex,
'visibility': Visibility,
'wind-status': WindStatus,
},
data () {
return {
}
},
methods: {
},
computed: {
},
}
</script>
<style>
</style>
</code></pre>
<p>Once you save the code and see the web page, you are <em>expected to see errors</em> in the Developer Console tool provided by the browser; they appear because although <code>Highlights.vue</code> is sending data, nobody is receiving them. We are yet to write the code for the <em>children</em> of <code>Highlights.vue</code>.</p>
<p>Observe that we have not done much of the data processing, i.e, we have not extracted the individual factors of weather data that goes under the Highlights section of the dashboard. We could have done that in the <code>data()</code> function, but we preferred to keep <code>Highlights.vue</code> a dumb component that just passes on the entire data dump it receives to each of the children, who then own their own extracts what is necessary for them. However, we encourage you to try out extracting data in the <code>Highlights.vue</code>, and send relevant data down to each child component — it’s a good practice exercise nonetheless!</p>
<h5>src/components/UVIndex.vue</h5>
<p>The code for this component receives the data dump of highlights from <code>Highlights.vue</code>, extracts the data for UV Index, and renders it on the page.</p>
<pre><code><template>
<div id="uvindex">
<p>UV Index: {{ uvindex }}</p>
</div>
</template>
<script>
export default {
props: ["highlights"],
data () {
return {
uvindex: this.highlights.uvindex
}
},
methods: {
},
computed: {
},
}
</script>
<style>
</style>
</code></pre>
<h5>src/components/Visibility.vue</h5>
<p>The code for this component receives the data dump of highlights from <code>Highlights.vue</code>, extracts the data for Visibility, and renders it on the page.</p>
<pre><code><template>
<div id="visibility">
<p>Visibility: {{ visibility }}</p>
</div>
</template>
<script>
export default {
props: ["highlights"],
data () {
return {
visibility: this.highlights.visibility,
}
},
methods: {
},
computed: {
},
}
</script>
<style>
</style>
</code></pre>
<h5>src/components/WindStatus.vue</h5>
<p>The code for this component receives the data dump of highlights from <code>Highlights.vue</code>, extracts the data for Wind Status (speed and direction), and renders it on the page.</p>
<div>
<pre><code><template>
<div id="windstatus">
<p>Wind Status:</p>
<p>Speed — {{ speed }}; Direction — {{ direction }}</p>
</div>
</template>
<script>
export default {
props: ["highlights"],
data () {
return {
speed: this.highlights.windstatus.speed,
direction: this.highlights.windstatus.direction
}
},
methods: {
},
computed: {
},
}
</script>
<style>
</style>
</code></pre>
</div>
<p>After adding the code for all the components, take a look at the web page on the browser.</p>
<figure><a target="_blank" href="https://cloud.netlifyusercontent.com/assets/344dbf88-fdf9-42bb-adb4-46f01eedd629/b8418772-369a-43ba-a5b5-c781f4fcd697/interactive-weather-dashboard-image10.png"><br />
<img decoding="async" src="https://res.cloudinary.com/indysigner/image/fetch/f_auto,q_auto/w_400/https://cloud.netlifyusercontent.com/assets/344dbf88-fdf9-42bb-adb4-46f01eedd629/b8418772-369a-43ba-a5b5-c781f4fcd697/interactive-weather-dashboard-image10.png" alt="Result of the code displayed in the browser"></a><figcaption>
(<a target="_blank" href="https://cloud.netlifyusercontent.com/assets/344dbf88-fdf9-42bb-adb4-46f01eedd629/b8418772-369a-43ba-a5b5-c781f4fcd697/interactive-weather-dashboard-image10.png">Large preview</a>)<br />
</figcaption></figure>
<p>Not to dishearten, but all these toiling was just to link the components in hierarchy, and test out whether data flow is happening between them or not! In the next section, we will <em>throw away most of the code we have written so far</em>, and add a lot more pertaining to the actual project. However, we will certainly retain the structure and nesting of the components; the learnings from this section will allow us to build a decent dashboard with Vue.js.</p>
<h3>4. Data Acquisition And Processing</h3>
<p>Remember the <code>weather_data</code> object in <code>App.vue</code>? It had some hard-coded data that we used to test whether all the components are working correctly, and also to help you learn some basic aspects of Vue application without getting bogged down in the details of real-world data. However, it’s now time that we shed our shell, and step out into the real world, where data from the API will dominate most of our code.</p>
<h4>Preparing Child Components To Receive And Process Real Data</h4>
<p>In this section, you will get code dump for all the components except <code>App.vue</code>. The code will handle receiving real data from <code>App.vue</code> (unlike the code we wrote in the previous section to receive and render dummy data).</p>
<p>We strongly encourage to read the code of each component carefully, so that you form an idea of what data each of those components are expecting, and will eventually use in visualization.</p>
<p>Some of the code, and the overall structure, will be similar to the ones you have seen in the previous structure — so you will not face something drastically different. However, the devil is in the details! So examine the code carefully, and when you have understood them reasonably well, copy the code to the respective component files in your project.</p>
<p><strong>Note</strong>: <em>All the components in this section are in the <code>src/components/</code> directory. So each time, the path will not be mentioned — only the <code>.vue</code> file name will be mentioned to identify the component.</em></p>
<h5>Content.vue</h5>
<div>
<pre><code><template>
<div style="position: relative;">
<temp-var-chart :tempVar="tempVar"></temp-var-chart>
<today-highlights :highlights="highlights"></today-highlights>
</div>
</template>
<script>
import TempVarChart from './TempVarChart.vue';
import Highlights from './Highlights.vue';
export default {
props: ['highlights', 'tempVar'],
components: {
'temp-var-chart': TempVarChart,
'today-highlights': Highlights
},
}
</script>
</code></pre>
</div>
<p>The following changes have been made from the previous code:</p>
<ul>
<li>In the <code></code>, text and data within <code>{{ }}</code> has been removed, since we are now just receiving data and passing down to the children, with no rendering specific this component.</li>
<li>In the <code>export default {}</code>:
<ul>
<li>The <code>props</code> have been changed to match the data objects that will be send by the parent: <code>App.vue</code>. The reason for changing the props is that <code>App.vue</code> itself will display some of the data it acquires from the weather API and other online resources, based on the search query of the user, and pass on the rest of the data. In the dummy code we wrote earlier, <code>App.vue</code> was passing on the entire dummy data dump, without any discrimination, and the props of <code>Content.vue</code> was set up accordingly.</li>
<li>The data() function now returns nothing, as we are not doing any data manipulation in this component.</li>
</ul>
</li>
</ul>
<h5>TempVarChart.vue</h5>
<p>This component is supposed to receive detailed temperature projections for the rest of the current day, and eventually display them using FusionCharts. But for the time being, we will display them only as text on the webpage.</p>
<pre><code><template>
<div>
{{ tempVar.tempToday }}
</div>
</template>
<script>
export default {
props: ["tempVar"],
components: {},
data() {
return {
};
},
methods: {
},
};
</script>
<style>
</style>
</code></pre>
<h5>Highlights.vue</h5>
<pre><code><template>
<div>
<uv-index :highlights="highlights"></uv-index>
<visibility :highlights="highlights"></visibility>
<wind-status :highlights="highlights"></wind-status>
</div>
</template>
<script>
import UVIndex from './UVIndex.vue';
import Visibility from './Visibility.vue';
import WindStatus from './WindStatus.vue';
export default {
props: ["highlights"],
components: {
'uv-index': UVIndex,
'visibility': Visibility,
'wind-status': WindStatus,
},
data () {
return {
}
},
methods: {
},
computed: {
},
}
</script>
<style>
</style>
</code></pre>
<p>The changes made from the previous code are:</p>
<ul>
<li>In the <code></code>, the text and the data within <code>{{ }}</code> has been removed, because this is a dumb component, just like <code>Content.vue</code>, whose only job is to pass on the data to children while maintaining the structural hierarchy. Remember that dumb components like <code>Highlights.vue</code> and <code>Content.vue</code> exists to maintain the parity between the visual structure of the dashboard, and the code we write.</li>
</ul>
<h5>UVIndex.vue</h5>
<p>The changes made to the previous code are as follows:</p>
<ul>
<li>In the <code></code> and <code></code>, the <code>div id</code> has been changed to <code>uvIndex</code>, which is more readable.</li>
<li>In the <code>export default {}</code>, the <code>data()</code> function now returns a string object <code>uvIndex</code>, whose value is extracted from the highlights object received by the component using <code>props</code>. This <code>uvIndex</code> is now temporarily used to display the value as text within the <code></code>. Later on, we will plug in this value to the data structure suitable for rendering a chart.</li>
</ul>
<h5>Visibility.vue</h5>
<pre><code><template>
<div>
<p>Visibility: {{ visibility }}</p>
</div>
</template>
<script>
export default {
props: ["highlights"],
data () {
return {
visibility: this.highlights.visibility.toString()
}
},
methods: {
},
computed: {
},
}
</script>
<style>
</style>
</code></pre>
<p>The only change made in this file (with respect to its previous code) is that the definition of the <code>visibility</code> object returned by the <code>data()</code> function now contains <code>toString()</code> at its end, since the value received from the parent will be a floating point number, which needs to be converted into string.</p>
<h5>WindStatus.vue</h5>
<div>
<pre><code><template>
<div>
<p>Wind Speed — {{ windSpeed }}</p>
<p>Wind Direction — {{ derivedWindDirection }}, or {{ windDirection }} degree clockwise with respect to true N as 0 degree.</p>
</div>
</template>
<script>
export default {
props: ["highlights"],
data () {
return {
windSpeed: this.highlights.windStatus.windSpeed,
derivedWindDirection: this.highlights.windStatus.derivedWindDirection,
windDirection: this.highlights.windStatus.windDirection
}
},
methods: {
},
computed: {
},
}
</script>
<style>
</style>
</code></pre>
</div>
<p>The changes made to the previous code are as follows:</p>
<ul>
<li>Throughout the file, <code>windstatus</code> has been renamed as <code>windStatus</code>, to promote readability and also to be in sync with the the highlights object that <code>App.vue</code> provides with actual data.</li>
<li>Similar naming changes have been made for the speed and direction — the new ones are <code>windSpeed</code> and <code>windDirection</code>.</li>
<li>A new object <code>derivedWindDirection</code> has come into play (also provided by <code>App.vue</code> in the highlights bundle).</li>
</ul>
<p>For now, the received data is rendered as text; later, it will be plugged in to the data structure necessary for visualization.</p>
<h4>Testing With Dummy Data</h4>
<p>Resorting to dummy data repeatedly might be a bit frustrating for you, but there are some good reasons behind it:</p>
<ul>
<li>We have made a lot of changes to the code of each component, and it’s a good idea to test whether those changes are breaking the code. In other words, we should check that whether the data flow is intact, now that we are about to move to more complex parts of the project.</li>
<li>The real data from the online weather API will need lot of massaging, and it might be overwhelming for you to juggle between the code for data acquisition and processing, and the code for smooth data flow down the components. The idea is to keep the quantum of complexity under control, so that we have a better understanding of the errors we might face.</li>
</ul>
<p>In this section, what we do is essentially hardcode some json data in the <code>App.vue</code>, which will obviously be replaced with live data in the near future. There are a lot of similarity between the dummy json structure, and the json structure we will use for the actual data. So it also provides you a rough idea of what to expect from the real data, once we encounter it.</p>
<p>However, we admit that this is far from the ideal approach one might adopt while building such a project from scratch. In the real world, you will often start with the real data source, play around with it a bit to understand what can and should be done to tame it, and then think about the appropriate json data structure to capture the relevant information. We intentionally shielded you from all those dirty work, since it takes you farther from the objective — learning how to use Vue.js and FusionCharts to build a dashboard.</p>
<p>Let’s now jump into the new code for App.vue:</p>
<div>
<pre><code><template>
<div id="app">
<dashboard-content :highlights="highlights" :tempVar="tempVar"></dashboard-content>
</div>
</template>
<script>
import Content from './components/Content.vue'
export default {
name: 'app',
components: {
'dashboard-content': Content
},
data () {
return {
tempVar: {
tempToday: [
{hour: '11.00 AM', temp: '35'},
{hour: '12.00 PM', temp: '36'},
{hour: '1.00 PM', temp: '37'},
{hour: '2.00 PM', temp: '38'},
{hour: '3.00 PM', temp: '36'},
{hour: '4.00 PM', temp: '35'},
],
},
highlights: {
uvIndex: 4,
visibility: 10,
windStatus: {
windSpeed: '30 km/h',
windDirection: '30',
derivedWindDirection: 'NNE',
},
},
}
},
methods: {
},
computed: {
},
}
</script>
<style>
</style>
</code></pre>
</div>
<p>The changes made to the code with respect to its previous version are as follows:</p>
<ul>
<li>The name of the child component has been changed to dashboard-content, and accordingly the custom HTML element in the <code></code> has been revised. Note that now we have two attributes — <code>highlights</code> and <code>tempVar</code> — instead of a single attribute that we used earlier with the custom element. Accordingly, the data associated with those attributes have also changed. What’s interesting here is that we can use the <code>v-bind:</code> directive, or its shorthand <code>:</code> (as we have done here), with multiple attributes of a custom HTML element!</li>
<li>The <code>data()</code> function now returns the <code>filename</code> object (that existed earlier), along with two new objects (instead of the old <code>weather_data</code>): <code>tempVar</code> and <code>highlights</code>. The structure of the json is appropriate for the code we have written in the child components, so that they can extract the data pieces they need from the dumps. The structures are quite self-explanatory, and you can expect them to be quite similar when we deal with live data. However, the significant change that you will encounter is the absence of hardcoding (obvious, isn’t it) — we will leave the values blank as the default state, and write code to dynamically update them based on the values we will receive from the weather API.</li>
</ul>
<p>You have written a lot of code in this section, without seeing the actual output. Before you proceed further, take a look at the browser (restart the server with <code>npm run dev</code>, if necessary), and bask in the glory of your achievement. The web page that you should see at this point looks like the image below:</p>
<figure><a target="_blank" href="https://cloud.netlifyusercontent.com/assets/344dbf88-fdf9-42bb-adb4-46f01eedd629/32be6750-69fb-4cad-8f0c-8d07ab08d107/interactive-weather-dashboard-image11.png"><br />
<img decoding="async" src="https://res.cloudinary.com/indysigner/image/fetch/f_auto,q_auto/w_400/https://cloud.netlifyusercontent.com/assets/344dbf88-fdf9-42bb-adb4-46f01eedd629/32be6750-69fb-4cad-8f0c-8d07ab08d107/interactive-weather-dashboard-image11.png" alt="Result of the code displayed in the browser"></a><figcaption>
(<a target="_blank" href="https://cloud.netlifyusercontent.com/assets/344dbf88-fdf9-42bb-adb4-46f01eedd629/32be6750-69fb-4cad-8f0c-8d07ab08d107/interactive-weather-dashboard-image11.png">Large preview</a>)<br />
</figcaption></figure>
<h4>Code For Data Acquisition And Processing</h4>
<p>This section is going to be the meat of the project, with all the code to be written in <code>App.vue</code> for the following:</p>
<ul>
<li>Location input from the user — an input box and a call-to-action button is sufficient;</li>
<li>Utility functions for various tasks; these functions will be called later in various parts of the component code;</li>
<li>Getting detailed geolocation data from Google Maps API for JavaScript;</li>
<li>Getting detailed weather data from the Dark Sky API;</li>
<li>Formatting and processing the geolocation and weather data, which will be passed on to the child components.</li>
</ul>
<p>The subsections that follows illustrates how we can implement the tasks laid out for us in the above points. With some exceptions, most of them will follow the sequence.</p>
<h4>Input From The User</h4>
<p>It’s quite obvious that the action starts when the user provides the name of the place for which the weather data needs to be displayed. For this to happen, we need to implement the following:</p>
<ul>
<li>An input box for entering the location;</li>
<li>A submit button that tells our application that the user has entered the location and it’s time to do the rest. We will also implement the behavior when processing starts upon hitting <kbd>Enter</kbd>.</li>
</ul>
<p>The code we show below will be restricted to the HTML template part of <code>App.vue</code>. We will just mention the name of the method associated with the click events, and define them later in the methods object of the in App.vue.</p>
<div>
<pre><code><div id="search">
<input
id="location-input"
type="text"
ref="input"
placeholder="Location?"
@keyup.enter="organizeAllDetails"
>
<button id="search-btn" @click="organizeAllDetails">
<img src="./assets/Search.svg" width="24" height="24">
</button>
</div>
</code></pre>
</div>
<p>Placing the above snippet in the right place is trivial — we leave it to you. However, the interesting parts of the snippet are:</p>
<ul>
<li><code>@keyup.enter="organizeAllDetails"</code></li>
<li><code>@click="organizeAllDetails"</code></li>
</ul>
<p>As you know from the earlier sections, <code>@</code> is Vue’s shorthand for the directive <code>v-on</code>:, which is associated with some event. The new thing is “<code>organizeAllDetails</code>” — it’s nothing but the method that will fire once the events (pressing <kbd>Enter</kbd> or clicking the button) happens. We are yet to define method, and the puzzle will be complete by the end of this section.</p>
<h4>Text Information Display Controlled By App.vue</h4>
<p>Once the user input triggers the action and lots of data is acquired from the APIs, we encounter the inevitable question — “What to do with all these data?”. Obviously some data massaging is required, but that does not answer our question fully! We need to decide what’s the end use of the data, or more directly, which are the entities that receives different chunks of the acquired and processed data?</p>
<p>The child components of <code>App.vue</code>, based on their hierarchy and purpose, are the frontline contenders for the bulk of the data. However, we will also have some data that does not belong to any of those child components, yet are quite informative and makes the dashboard complete. We can make good use of them if we display them as text information directly controlled by <code>App.vue</code>, while the rest of the data are passed on to the child for getting displayed as pretty charts ultimately.</p>
<p>With this context in mind, let’s focus on the code for setting the stage of using text data. It’s simple HTML template at this point, on which the data will eventually come and sit.</p>
<div>
<pre><code><div id="info">
<div class="wrapper-left">
<div id="current-weather">
{{ currentWeather.temp }}
<span>°C</span>
</div>
<div id="weather-desc">{{ currentWeather.summary }}</div>
<div class="temp-max-min">
<div class="max-desc">
<div id="max-detail">
<i>▲</i>
{{ currentWeather.todayHighLow.todayTempHigh }}
<span>°C</span>
</div>
<div id="max-summary">at {{ currentWeather.todayHighLow.todayTempHighTime }}</div>
</div>
<div class="min-desc">
<div id="min-detail">
<i>▼</i>
{{ currentWeather.todayHighLow.todayTempLow }}
<span>°C</span>
</div>
<div id="min-summary">at {{ currentWeather.todayHighLow.todayTempLowTime }}</div>
</div>
</div>
</div>
<div class="wrapper-right">
<div class="date-time-info">
<div id="date-desc">
<img src="./assets/calendar.svg" width="20" height="20">
{{ currentWeather.time }}
</div>
</div>
<div class="location-info">
<div id="location-desc">
<img
src="./assets/location.svg"
width="10.83"
height="15.83"
style="opacity: 0.9;"
>
{{ currentWeather.full_location }}
<div id="location-detail" class="mt-1">
Lat: {{ currentWeather.formatted_lat }}
<br>
Long: {{ currentWeather.formatted_long }}
</div>
</div>
</div>
</div>
</div>
</code></pre>
</div>
<p>In the above snippet, you should understand the following:</p>
<ul>
<li>The stuff inside <code>{{ }}</code> — they are Vue’s way of inserting dynamic data in the HTML template, before it renders in the browser. You have encountered them before, and there is nothing new or surprising. Just keep in mind that these data objects stems from the <code>data()</code> method in the <code>export default()</code> object of <code>App.vue</code>. They have default values that we will set according to our requirements, and then write certain methods to populate the objects with real API data.</li>
</ul>
<p>Don’t worry for not seeing the changes on the browser — the data is not defined yet, and it’s natural for Vue to not render things that it does not know. However, <strong>once the data is set</strong> (and for now, you can even check by hard-coding the data), the text data will be controlled by <code>App.vue</code>.</p>
<h4>The <code>data()</code> Method</h4>
<p>The <code>data()</code> method is a special construct in the <code>.vue</code> files — it contains and returns data objects that are so crucial for the application. Recollect the generic structure of the <code></code> part in any <code>.vue</code> file — it roughly contains the following:</p>
<div>
<pre><code><script>
// import statements here
export default {
// name, components, props, etc.
data() {
return {
// the data that is so crucial for the application is defined here.
// the data objects will have certain default values chosen by us.
// The methods that we define below will manipulate the data.
// Since the data is bounded to various attributes and directives, they
// will update as and when the values of the data objects change.
}
},
methods: {
// methods (objects whose values are functions) here.
// bulk of dynamic stuff (the black magic part) is controlled from here.
},
computed: {
// computed properties here
},
// other objects, as necessary
}
</script>
</code></pre>
</div>
<p>So far, you have encountered the names of some of the data objects, but are a lot more. Most of them are relevant for the child components, each of which handles a different aspect of the weather information dump. Given below is the entire <code>data()</code> method that we will need for this project — you will have a fair idea about what data we are expecting from the APIs, and how we are disseminating the data, based on the nomenclature of the objects.</p>
<div>
<pre><code>data() {
return {
weatherDetails: false,
location: '', // raw location from input
lat: '', // raw latitude from google maps api response
long: '', // raw longitude from google maps api response
completeWeatherApi: '', // weather api string with lat and long
rawWeatherData: '', // raw response from weather api
currentWeather: {
full_location: '', // for full address
formatted_lat: '', // for N/S
formatted_long: '', // for E/W
time: '',
temp: '',
todayHighLow: {
todayTempHigh: '',
todayTempHighTime: '',
todayTempLow: '',
todayTempLowTime: ''
},
summary: '',
possibility: ''
},
tempVar: {
tempToday: [
// gets added dynamically by this.getSetHourlyTempInfoToday()
],
},
highlights: {
uvIndex: '',
visibility: '',
windStatus: {
windSpeed: '',
windDirection: '',
derivedWindDirection: ''
},
}
};
},
</code></pre>
</div>
<p>As you can see, in most cases the default value is empty, because that will suffice at this point. Methods will be written for manipulating the data and filling it up with appropriate values, before it is rendered or passed on to the child components.</p>
<h5>Methods in App.vue</h5>
<p>For <code>.vue</code> files, the methods are generally written as values of keys nested in the <code>methods { }</code> object. Their primary role is to manipulate the data objects of the component. We will write the methods in <code>App.vue</code> keeping the same philosophy in mind. However, based on their purpose, we can categorize the methods of <code>App.vue</code> into the following:</p>
<ul>
<li>Utility methods</li>
<li>Action/Event oriented methods</li>
<li>Data acquisition methods</li>
<li>Data processing methods</li>
<li>High level glue methods</li>
</ul>
<p>It’s important that you understand this — we are presenting the methods to you on a platter because we have already figured out how the APIs work, what data they give, and how we should use the data in our project. It’s not that we pulled the methods out of thin air, and wrote some arcane code to deal with the data. For the purpose of learning, it’s a good exercise to diligently read and understand the code for the methods and data. However, when faced with a new project that you have to build from scratch, you must do all the dirty work yourself, and that means experimenting a lot with the APIs — their programmatic access and their data structure, before glueing them seamlessly with the data structure that your project demands. You will not have any hand holding, and there will be frustrating moments, but that’s all part of maturing as a developer.</p>
<p>In the following subsections, we will explain each of the method types, and also show the implementation of the methods belonging to that category. The method names are quite self-explanatory about their purpose, and so is their implementation, which we believe you will find to be easy enough to follow. However, before that, recollect the general scheme of writing methods in <code>.vue</code> files:</p>
<div>
<pre><code><script>
// import statements here
export default {
// name, components, props, etc.
data() {
return {
// the data that is so crucial for the application is defined here.
}
},
methods: {
// methods (objects whose values are functions) here.
// bulk of dynamic stuff (the black magic part) is controlled from here.
method_1: function(arg_1) {
},
method_2: function(arg_1, arg_2) {
},
method_3: function(arg_1) {
},
…….
},
computed: {
// computed properties here
},
// other objects, as necessary
}
</script>
</code></pre>
</div>
<h4>Utility Methods</h4>
<p>The utility methods, as the name suggests, are methods written primarily for the purpose of modularizing repetitive code used for fringe tasks. They are called by other methods when necessary. Given below are the utility methods for <code>App.vue</code>:</p>
<div>
<pre><code>convertToTitleCase: function(str) {
str = str.toLowerCase().split(' ');
for (var i = 0; i </code></pre>
</div>
<div>
<pre><code>// To format the “possibility” (of weather) string obtained from the weather API
formatPossibility: function(str) {
str = str.toLowerCase().split('-');
for (var i = 0; i </code></pre>
</div>
<div>
<pre><code>// To convert Unix timestamps according to our convenience
unixToHuman: function(timezone, timestamp) {
/* READ THIS BEFORE JUDGING & DEBUGGING
For any location beyond the arctic circle and the
antarctic circle, the goddamn weather api does not return certain
keys/values in each of this.rawWeatherData.daily.data[some_array_index].
Due to this, console throws up an error.
The code is correct, the problem is with the API.
May be later on I will add some padding to tackle missing values.
*/
var moment = require('moment-timezone'); // for handling date & time
var decipher = new Date(timestamp * 1000);
var human = moment(decipher)
.tz(timezone)
.format('llll');
var timeArray = human.split(' ');
var timeNumeral = timeArray[4];
var timeSuffix = timeArray[5];
var justTime = timeNumeral + ' ' + timeSuffix;
var monthDateArray = human.split(',');
var monthDate = monthDateArray[1].trim();
return {
fullTime: human,
onlyTime: justTime,
onlyMonthDate: monthDate
};
},
</code></pre>
</div>
<div>
<pre><code>// To convert temperature from fahrenheit to celcius
fahToCel: function(tempInFahrenheit) {
var tempInCelcius = Math.round((5 / 9) * (tempInFahrenheit — 32));
return tempInCelcius;
},
</code></pre>
</div>
<div>
<pre><code>// To convert the air pressure reading from millibar to kilopascal
milibarToKiloPascal: function(pressureInMilibar) {
var pressureInKPA = pressureInMilibar * 0.1;
return Math.round(pressureInKPA);
},
</code></pre>
</div>
<div>
<pre><code>// To convert distance readings from miles to kilometers
mileToKilometer: function(miles) {
var kilometer = miles * 1.60934;
return Math.round(kilometer);
},
</code></pre>
</div>
<div>
<pre><code>// To format the wind direction based on the angle
deriveWindDir: function(windDir) {
var wind_directions_array = [
{ minVal: 0, maxVal: 30, direction: 'N' },
{ minVal: 31, maxVal: 45, direction: 'NNE' },
{ minVal: 46, maxVal: 75, direction: 'NE' },
{ minVal: 76, maxVal: 90, direction: 'ENE' },
{ minVal: 91, maxVal: 120, direction: 'E' },
{ minVal: 121, maxVal: 135, direction: 'ESE' },
{ minVal: 136, maxVal: 165, direction: 'SE' },
{ minVal: 166, maxVal: 180, direction: 'SSE' },
{ minVal: 181, maxVal: 210, direction: 'S' },
{ minVal: 211, maxVal: 225, direction: 'SSW' },
{ minVal: 226, maxVal: 255, direction: 'SW' },
{ minVal: 256, maxVal: 270, direction: 'WSW' },
{ minVal: 271, maxVal: 300, direction: 'W' },
{ minVal: 301, maxVal: 315, direction: 'WNW' },
{ minVal: 316, maxVal: 345, direction: 'NW' },
{ minVal: 346, maxVal: 360, direction: 'NNW' }
];
var wind_direction = '';
for (var i = 0; i = wind_directions_array[i].minVal &&
windDir </code></pre>
</div>
<p>Although we haven’t implemented it, you can take out the utility methods from the <code>.vue</code> file, and put it in a separate JavaScript file. All you need to do is import the <code>.js</code> file at the start of the script part in the <code>.vue</code> file, and you should be good to go. Such approach works really well and keeps the code clean, especially in big applications where you might use lots of methods that are better grouped together based on their purpose. You can apply this approach to all of the method groups listed in this article, and see the effect itself. However, we suggest you do that exercise once you have followed the course presented here, so that you have the big picture understanding of all the parts working in complete sync, and also have a working piece of software which you can refer to, once something breaks while experimenting.</p>
<h4>Action/Event Oriented Methods</h4>
<p>These methods are generally executed when we need to take an action corresponding to an event. Depending on the case, the event might be triggered from an user interaction, or programmatically. In the <code>App.vue</code> file, these methods sit below the utility methods.</p>
<pre><code>makeInputEmpty: function() {
this.$refs.input.value = '';
},
</code></pre>
<pre><code>makeTempVarTodayEmpty: function() {
this.tempVar.tempToday = [];
},
</code></pre>
<pre><code>detectEnterKeyPress: function() {
var input = this.$refs.input;
input.addEventListener('keyup', function(event) {
event.preventDefault();
var enterKeyCode = 13;
if (event.keyCode === enterKeyCode) {
this.setHitEnterKeyTrue();
}
});
},
</code></pre>
<div>
<pre><code>locationEntered: function() {
var input = this.$refs.input;
if (input.value === '') {
this.location = "New York";
} else {
this.location = this.convertToTitleCase(input.value);
}
this.makeInputEmpty();
this.makeTempVarTodayEmpty();
},
</code></pre>
</div>
<p>One interesting thing in some of the above code snippets is the use of <code>$ref</code>. In simple terms, it’s Vue’s way of associating the code statement containing it, to the HTML construct it is supposed to affect (for more information, read the <a target="_blank" href="https://vuejs.org/v2/api/#vm-refs">official guide</a>). For example, the methods <code>makeInputEmpty()</code> and <code>detectEnterKeyPress()</code> affects the input box, because in the HTML of the input box we have mentioned the value of the attribute <code>ref</code> as <code>input</code>.</p>
<h4>Data Acquisition Methods</h4>
<p>We are using the following two APIs in our project:</p>
<ul>
<li><a target="_blank" href="https://developers.google.com/maps/documentation/geocoding/intro">Google Maps Geocoder API</a><br />
This API is for getting the coordinates of the location that the user searches. You will need an API key for yourself, which you can get by following the documentation in the given link. For now, you can use the API key used by FusionCharts, but we request you not to abuse it and get a key of your own. We refer to the JavaScript API from the index.html of this project, and we shall use the constructors provided by it for our code in the <code>App.vue</code> file.</li>
<li><a target="_blank" href="https://darksky.net/dev">The Dark Sky Weather API</a><br />
This API is for getting the weather data corresponding to the coordinates. However, we won’t be using it directly; we will wrap it within an URL that redirects through one of the FusionCharts’s server. The reason is that if you send a GET request to the API from an entirely client-end application such as ours, it results in the frustrating <code>CORS</code> error (more information <a target="_blank" href="https://developer.mozilla.org/en-US/docs/Web/HTTP/CORS">here</a> and <a target="_blank" href="https://www.w3.org/TR/html5/infrastructure.html#cors-settings-attribute">here</a>).</li>
</ul>
<p><strong>Important Note</strong>: <em>Since we have used Google Maps and Dark Sky APIs, Both these APIs have their own API keys which we have shared with you in this article. This will help you focus on client-side developments rather than the headache of backend implementation. However, <strong>we recommend you to create your own keys</strong>, because our APIs keys will come with limits and if these limits exceed you won’t be able to try the application by yourself.</em></p>
<p>For Google Maps, <a target="_blank" href="https://developers.google.com/maps/documentation/javascript/get-api-key">go to this article</a> to get your API key. For Dark Sky API, visit <a target="_blank" href="https://darksky.net/dev">https://darksky.net/dev</a> to create your API key and respective endpoints.</p>
<p>With the context in mind, let’s see the implementation of the data acquisition methods for our project.</p>
<div>
<pre><code>getCoordinates: function() {
this.locationEntered();
var loc = this.location;
var coords;
var geocoder = new google.maps.Geocoder();
return new Promise(function(resolve, reject) {
geocoder.geocode({ address: loc }, function(results, status) {
if (status == google.maps.GeocoderStatus.OK) {
this.lat = results[0].geometry.location.lat();
this.long = results[0].geometry.location.lng();
this.full_location = results[0].formatted_address;
coords = {
lat: this.lat,
long: this.long,
full_location: this.full_location
};
resolve(coords);
} else {
alert("Oops! Couldn't get data for the location");
}
});
});
},
</code></pre>
</div>
<div>
<pre><code>/*
The coordinates that Google Maps Geocoder API returns are way too accurate
for our requirements. We need to bring it into shape before passing the coordinates on
to the weather API. Although this is a data processing method in its own right, we can't
help mentioning it right now, because the data acquisition method for the weather API has dependency on the output of this method.
*/
setFormatCoordinates: async function() {
var coordinates = await this.getCoordinates();
this.lat = coordinates.lat;
this.long = coordinates.long;
this.currentWeather.full_location = coordinates.full_location;
// Remember to beautify lat for N/S
if (coordinates.lat > 0) {
this.currentWeather.formatted_lat =
(Math.round(coordinates.lat * 10000) / 10000).toString() + '°N';
} else if (coordinates.lat 0) {
this.currentWeather.formatted_long =
(Math.round(coordinates.long * 10000) / 10000).toString() + '°E';
} else if (coordinates.long </code></pre>
</div>
<div>
<pre><code>/*
This method dynamically creates the the correct weather API query URL, based on the
formatted latitude and longitude. The complete URL is then fed to the method querying for
weather data.
Notice that the base URL used in this method (without the coordinates) points towards a
FusionCharts server — we must redirect our GET request to the weather API through a server to avoid the CORS error.
*/
fixWeatherApi: async function() {
await this.setFormatCoordinates();
var weatherApi =
'https://csm.fusioncharts.com/files/assets/wb/wb-data.php?src=darksky&lat=' +
this.lat +
'&long=' +
this.long;
this.completeWeatherApi = weatherApi;
},
</code></pre>
</div>
<div>
<pre><code>fetchWeatherData: async function() {
await this.fixWeatherApi();
var axios = require('axios'); // for handling weather api promise
var weatherApiResponse = await axios.get(this.completeWeatherApi);
if (weatherApiResponse.status === 200) {
this.rawWeatherData = weatherApiResponse.data;
} else {
alert('Hmm... Seems like our weather experts are busy!');
}
},
</code></pre>
</div>
<p>Through these methods, we have introduced the concept of <strong>async-await</strong> in our code. If you have been a JavaScript developer for some time now, you must be familiar with the <a target="_blank" href="http://callbackhell.com/">callback hell</a>, which is a direct consequence of the asynchronous way JavaScript is written. ES6 allows us to bypass the cumbersome nested callbacks, and our code becomes much cleaner if we write JavaScript in a synchronous way, using the <a target="_blank" href="https://developer.mozilla.org/en-US/docs/Web/JavaScript/Reference/Statements/async_function">async-await</a> technique. However, there is a downside. It takes away the speed that asynchronous code gives us, especially for the portions of the code that deals with data being exchanged over the internet. Since this is not a mission-critical application with low latency requirements, and our primary aim is to learn stuff, the clean code is much more preferable over the slightly fast code.</p>
<h4>Data Processing Methods</h4>
<p>Now that we have the methods that will bring the data to us, we need to prepare the ground for properly receiving and processing the data. Safety nets must be cast, and there should be no spills — data is the new gold (OK, that might be an exaggeration in our context)! Enough with the fuss, let’s get to the point.</p>
<p>Technically, the methods we implement in this section are aimed at getting the data out of the acquisition methods and the data objects in <code>App.vue</code>, and sometimes setting the data objects to certain values that suits the purpose.</p>
<pre><code>getTimezone: function() {
return this.rawWeatherData.timezone;
},
</code></pre>
<pre><code>getSetCurrentTime: function() {
var currentTime = this.rawWeatherData.currently.time;
var timezone = this.getTimezone();
this.currentWeather.time = this.unixToHuman(
timezone,
currentTime
).fullTime;
},
</code></pre>
<div>
<pre><code>getSetSummary: function() {
var currentSummary = this.convertToTitleCase(
this.rawWeatherData.currently.summary
);
if (currentSummary.includes(' And')) {
currentSummary = currentSummary.replace(' And', ',');
}
this.currentWeather.summary = currentSummary;
},
</code></pre>
</div>
<div>
<pre><code>getSetPossibility: function() {
var possible = this.formatPossibility(this.rawWeatherData.daily.icon);
if (possible.includes(' And')) {
possible = possible.replace(' And', ',');
}
this.currentWeather.possibility = possible;
},
</code></pre>
</div>
<div>
<pre><code>getSetCurrentTemp: function() {
var currentTemp = this.rawWeatherData.currently.temperature;
this.currentWeather.temp = this.fahToCel(currentTemp);
},
</code></pre>
</div>
<pre><code>getTodayDetails: function() {
return this.rawWeatherData.daily.data[0];
},
</code></pre>
<div>
<pre><code>getSetTodayTempHighLowWithTime: function() {
var timezone = this.getTimezone();
var todayDetails = this.getTodayDetails();
this.currentWeather.todayHighLow.todayTempHigh = this.fahToCel(
todayDetails.temperatureMax
);
this.currentWeather.todayHighLow.todayTempHighTime = this.unixToHuman(
timezone,
todayDetails.temperatureMaxTime
).onlyTime;
this.currentWeather.todayHighLow.todayTempLow = this.fahToCel(
todayDetails.temperatureMin
);
this.currentWeather.todayHighLow.todayTempLowTime = this.unixToHuman(
timezone,
todayDetails.temperatureMinTime
).onlyTime;
},
</code></pre>
</div>
<pre><code>getHourlyInfoToday: function() {
return this.rawWeatherData.hourly.data;
},
</code></pre>
<div>
<pre><code>getSetHourlyTempInfoToday: function() {
var unixTime = this.rawWeatherData.currently.time;
var timezone = this.getTimezone();
var todayMonthDate = this.unixToHuman(timezone, unixTime).onlyMonthDate;
var hourlyData = this.getHourlyInfoToday();
for (var i = 0; i </code></pre>
</div>
<pre><code>getSetUVIndex: function() {
var uvIndex = this.rawWeatherData.currently.uvIndex;
this.highlights.uvIndex = uvIndex;
},
</code></pre>
<div>
<pre><code>getSetVisibility: function() {
var visibilityInMiles = this.rawWeatherData.currently.visibility;
this.highlights.visibility = this.mileToKilometer(visibilityInMiles);
},
</code></pre>
</div>
<div>
<pre><code>getSetWindStatus: function() {
var windSpeedInMiles = this.rawWeatherData.currently.windSpeed;
this.highlights.windStatus.windSpeed = this.mileToKilometer(
windSpeedInMiles
);
var absoluteWindDir = this.rawWeatherData.currently.windBearing;
this.highlights.windStatus.windDirection = absoluteWindDir;
this.highlights.windStatus.derivedWindDirection = this.deriveWindDir(
absoluteWindDir
);
},
</code></pre>
</div>
<h4>High Level Glue Methods</h4>
<p>With the utility, acquisition, and processing methods out of our way, we are now left with the task of orchestrating the entire thing. We do that by creating high level glue methods, that essentially calls the methods written above in a particular sequence, so that the entire operation is executed seamlessly.</p>
<pre><code>// Top level for info section
// Data in this.currentWeather
organizeCurrentWeatherInfo: function() {
// data in this.currentWeather
/*
Coordinates and location is covered (get & set) in:
— this.getCoordinates()
— this.setFormatCoordinates()
There are lots of async-await involved there.
So it's better to keep them there.
*/
this.getSetCurrentTime();
this.getSetCurrentTemp();
this.getSetTodayTempHighLowWithTime();
this.getSetSummary();
this.getSetPossibility();
},
</code></pre>
<pre><code>// Top level for highlights
organizeTodayHighlights: function() {
// top level for highlights
this.getSetUVIndex();
this.getSetVisibility();
this.getSetWindStatus();
},
</code></pre>
<pre><code>// Top level organization and rendering
organizeAllDetails: async function() {
// top level organization
await this.fetchWeatherData();
this.organizeCurrentWeatherInfo();
this.organizeTodayHighlights();
this.getSetHourlyTempInfoToday();
},
</code></pre>
<h5>mounted</h5>
<p>Vue provides instance <a target="_blank" href="https://vuejs.org/v2/guide/instance.html#Instance-Lifecycle-Hooks">lifecycle hooks</a> — properties that are essentially methods, and gets triggered when the instance lifecycle reaches that stage. For example, <a target="_blank" href="https://vuejs.org/v2/api/#created">created</a>, <a target="_blank" href="https://vuejs.org/v2/api/#mounted">mounted</a>, <a target="_blank" href="https://vuejs.org/v2/api/#beforeUpdate">beforeUpdate</a>, etc., are all very useful lifecycle hooks that allows the programmer to control the instance at a much more granular level than that would have been possible otherwise.</p>
<p>In the code of a Vue component, these lifecycle hooks are implemented just like you would for any other <code>prop</code>. For example:</p>
<pre><code><template>
</template>
<script>
// import statements
export default {
data() {
return {
// data objects here
}
},
methods: {
// methods here
},
mounted: function(){
// function body here
},
}
</script>
<style>
</style>
</code></pre>
<p>Armed with this new understanding, take a look at the code below for the <code>mounted</code> prop of <code>App.vue</code>:</p>
<pre><code>mounted: async function() {
this.location = "New York";
await this.organizeAllDetails();
}
</code></pre>
<h4>Complete Code For App.vue</h4>
<p>We have covered a lot of ground in this section, and the last few sections have given you things in bits and pieces. However, it’s important that you have the complete, assembled code for <code>App.vue</code> (subject to further modifications in subsequent sections). Here it goes:</p>
<div>
<pre><code><template>
<div id="ancestor">
<div class="container-fluid" id="app">
<div class="row">
<div id="sidebar" class="col-md-3 col-sm-4 col-xs-12 sidebar">
<div id="search">
<input
id="location-input"
type="text"
ref="input"
placeholder="Location?"
@keyup.enter="organizeAllDetails"
>
<button id="search-btn" @click="organizeAllDetails">
<img src="./assets/Search.svg" width="24" height="24">
</button>
</div>
<div id="info">
<div class="wrapper-left">
<div id="current-weather">
{{ currentWeather.temp }}
<span>°C</span>
</div>
<div id="weather-desc">{{ currentWeather.summary }}</div>
<div class="temp-max-min">
<div class="max-desc">
<div id="max-detail">
<i>▲</i>
{{ currentWeather.todayHighLow.todayTempHigh }}
<span>°C</span>
</div>
<div id="max-summary">at {{ currentWeather.todayHighLow.todayTempHighTime }}</div>
</div>
<div class="min-desc">
<div id="min-detail">
<i>▼</i>
{{ currentWeather.todayHighLow.todayTempLow }}
<span>°C</span>
</div>
<div id="min-summary">at {{ currentWeather.todayHighLow.todayTempLowTime }}</div>
</div>
</div>
</div>
<div class="wrapper-right">
<div class="date-time-info">
<div id="date-desc">
<img src="./assets/calendar.svg" width="20" height="20">
{{ currentWeather.time }}
</div>
</div>
<div class="location-info">
<div id="location-desc">
<img
src="./assets/location.svg"
width="10.83"
height="15.83"
style="opacity: 0.9;"
>
{{ currentWeather.full_location }}
<div id="location-detail" class="mt-1">
Lat: {{ currentWeather.formatted_lat }}
<br>
Long: {{ currentWeather.formatted_long }}
</div>
</div>
</div>
</div>
</div>
</div>
<dashboard-content
class="col-md-9 col-sm-8 col-xs-12 content"
id="dashboard-content"
:highlights="highlights"
:tempVar="tempVar"
></dashboard-content>
</div>
</div>
</div>
</template>
<script>
import Content from './components/Content.vue';
export default {
name: 'app',
props: [],
components: {
'dashboard-content': Content
},
data() {
return {
weatherDetails: false,
location: '', // raw location from input
lat: '', // raw latitude from google maps api response
long: '', // raw longitude from google maps api response
completeWeatherApi: '', // weather api string with lat and long
rawWeatherData: '', // raw response from weather api
currentWeather: {
full_location: '', // for full address
formatted_lat: '', // for N/S
formatted_long: '', // for E/W
time: '',
temp: '',
todayHighLow: {
todayTempHigh: '',
todayTempHighTime: '',
todayTempLow: '',
todayTempLowTime: ''
},
summary: '',
possibility: ''
},
tempVar: {
tempToday: [
// gets added dynamically by this.getSetHourlyTempInfoToday()
],
},
highlights: {
uvIndex: '',
visibility: '',
windStatus: {
windSpeed: '',
windDirection: '',
derivedWindDirection: ''
},
}
};
},
methods: {
// Some utility functions
convertToTitleCase: function(str) {
str = str.toLowerCase().split(' ');
for (var i = 0; i < str.length; i++) {
str[i] = str[i].charAt(0).toUpperCase() + str[i].slice(1);
}
return str.join(' ');
},
formatPossibility: function(str) {
str = str.toLowerCase().split('-');
for (var i = 0; i < str.length; i++) {
str[i] = str[i].charAt(0).toUpperCase() + str[i].slice(1);
}
return str.join(' ');
},
unixToHuman: function(timezone, timestamp) {
/* READ THIS BEFORE JUDGING & DEBUGGING
For any location beyond the arctic circle and the
antarctic circle, the goddamn weather api does not return certain
keys/values in each of this.rawWeatherData.daily.data[some_array_index].
Due to this, console throws up an error.
The code is correct, the problem is with the API.
May be later on I will add some padding to tackle missing values.
*/
var moment = require('moment-timezone'); // for handling date & time
var decipher = new Date(timestamp * 1000);
var human = moment(decipher)
.tz(timezone)
.format('llll');
var timeArray = human.split(' ');
var timeNumeral = timeArray[4];
var timeSuffix = timeArray[5];
var justTime = timeNumeral + ' ' + timeSuffix;
var monthDateArray = human.split(',');
var monthDate = monthDateArray[1].trim();
return {
fullTime: human,
onlyTime: justTime,
onlyMonthDate: monthDate
};
},
fahToCel: function(tempInFahrenheit) {
var tempInCelcius = Math.round((5 / 9) * (tempInFahrenheit — 32));
return tempInCelcius;
},
milibarToKiloPascal: function(pressureInMilibar) {
var pressureInKPA = pressureInMilibar * 0.1;
return Math.round(pressureInKPA);
},
mileToKilometer: function(miles) {
var kilometer = miles * 1.60934;
return Math.round(kilometer);
},
deriveWindDir: function(windDir) {
var wind_directions_array = [
{ minVal: 0, maxVal: 30, direction: 'N' },
{ minVal: 31, maxVal: 45, direction: 'NNE' },
{ minVal: 46, maxVal: 75, direction: 'NE' },
{ minVal: 76, maxVal: 90, direction: 'ENE' },
{ minVal: 91, maxVal: 120, direction: 'E' },
{ minVal: 121, maxVal: 135, direction: 'ESE' },
{ minVal: 136, maxVal: 165, direction: 'SE' },
{ minVal: 166, maxVal: 180, direction: 'SSE' },
{ minVal: 181, maxVal: 210, direction: 'S' },
{ minVal: 211, maxVal: 225, direction: 'SSW' },
{ minVal: 226, maxVal: 255, direction: 'SW' },
{ minVal: 256, maxVal: 270, direction: 'WSW' },
{ minVal: 271, maxVal: 300, direction: 'W' },
{ minVal: 301, maxVal: 315, direction: 'WNW' },
{ minVal: 316, maxVal: 345, direction: 'NW' },
{ minVal: 346, maxVal: 360, direction: 'NNW' }
];
var wind_direction = '';
for (var i = 0; i < wind_directions_array.length; i++) {
if (
windDir >= wind_directions_array[i].minVal &&
windDir <= wind_directions_array[i].maxVal
) {
wind_direction = wind_directions_array[i].direction;
}
}
return wind_direction;
},
// Some basic action oriented functions
makeInputEmpty: function() {
this.$refs.input.value = '';
},
makeTempVarTodayEmpty: function() {
this.tempVar.tempToday = [];
},
detectEnterKeyPress: function() {
var input = this.$refs.input;
input.addEventListener('keyup', function(event) {
event.preventDefault();
var enterKeyCode = 13;
if (event.keyCode === enterKeyCode) {
this.setHitEnterKeyTrue();
}
});
},
locationEntered: function() {
var input = this.$refs.input;
if (input.value === '') {
this.location = "New York";
} else {
this.location = this.convertToTitleCase(input.value);
}
this.makeInputEmpty();
this.makeTempVarTodayEmpty();
},
getCoordinates: function() {
this.locationEntered();
var loc = this.location;
var coords;
var geocoder = new google.maps.Geocoder();
return new Promise(function(resolve, reject) {
geocoder.geocode({ address: loc }, function(results, status) {
if (status == google.maps.GeocoderStatus.OK) {
this.lat = results[0].geometry.location.lat();
this.long = results[0].geometry.location.lng();
this.full_location = results[0].formatted_address;
coords = {
lat: this.lat,
long: this.long,
full_location: this.full_location
};
resolve(coords);
} else {
alert("Oops! Couldn't get data for the location");
}
});
});
},
// Some basic asynchronous functions
setFormatCoordinates: async function() {
var coordinates = await this.getCoordinates();
this.lat = coordinates.lat;
this.long = coordinates.long;
this.currentWeather.full_location = coordinates.full_location;
// Remember to beautify lat for N/S
if (coordinates.lat > 0) {
this.currentWeather.formatted_lat =
(Math.round(coordinates.lat * 10000) / 10000).toString() + '°N';
} else if (coordinates.lat < 0) {
this.currentWeather.formatted_lat =
(-1 * (Math.round(coordinates.lat * 10000) / 10000)).toString() +
'°S';
} else {
this.currentWeather.formatted_lat = (
Math.round(coordinates.lat * 10000) / 10000
).toString();
}
// Remember to beautify long for N/S
if (coordinates.long > 0) {
this.currentWeather.formatted_long =
(Math.round(coordinates.long * 10000) / 10000).toString() + '°E';
} else if (coordinates.long < 0) {
this.currentWeather.formatted_long =
(-1 * (Math.round(coordinates.long * 10000) / 10000)).toString() +
'°W';
} else {
this.currentWeather.formatted_long = (
Math.round(coordinates.long * 10000) / 10000
).toString();
}
},
fixWeatherApi: async function() {
await this.setFormatCoordinates();
var weatherApi =
'https://csm.fusioncharts.com/files/assets/wb/wb-data.php?src=darksky&lat=' +
this.lat +
'&long=' +
this.long;
this.completeWeatherApi = weatherApi;
},
fetchWeatherData: async function() {
await this.fixWeatherApi();
var axios = require('axios'); // for handling weather api promise
var weatherApiResponse = await axios.get(this.completeWeatherApi);
if (weatherApiResponse.status === 200) {
this.rawWeatherData = weatherApiResponse.data;
} else {
alert('Hmm... Seems like our weather experts are busy!');
}
},
// Get and set functions; often combined, because they are short
// For basic info — left panel/sidebar
getTimezone: function() {
return this.rawWeatherData.timezone;
},
getSetCurrentTime: function() {
var currentTime = this.rawWeatherData.currently.time;
var timezone = this.getTimezone();
this.currentWeather.time = this.unixToHuman(
timezone,
currentTime
).fullTime;
},
getSetSummary: function() {
var currentSummary = this.convertToTitleCase(
this.rawWeatherData.currently.summary
);
if (currentSummary.includes(' And')) {
currentSummary = currentSummary.replace(' And', ',');
}
this.currentWeather.summary = currentSummary;
},
getSetPossibility: function() {
var possible = this.formatPossibility(this.rawWeatherData.daily.icon);
if (possible.includes(' And')) {
possible = possible.replace(' And', ',');
}
this.currentWeather.possibility = possible;
},
getSetCurrentTemp: function() {
var currentTemp = this.rawWeatherData.currently.temperature;
this.currentWeather.temp = this.fahToCel(currentTemp);
},
getTodayDetails: function() {
return this.rawWeatherData.daily.data[0];
},
getSetTodayTempHighLowWithTime: function() {
var timezone = this.getTimezone();
var todayDetails = this.getTodayDetails();
this.currentWeather.todayHighLow.todayTempHigh = this.fahToCel(
todayDetails.temperatureMax
);
this.currentWeather.todayHighLow.todayTempHighTime = this.unixToHuman(
timezone,
todayDetails.temperatureMaxTime
).onlyTime;
this.currentWeather.todayHighLow.todayTempLow = this.fahToCel(
todayDetails.temperatureMin
);
this.currentWeather.todayHighLow.todayTempLowTime = this.unixToHuman(
timezone,
todayDetails.temperatureMinTime
).onlyTime;
},
getHourlyInfoToday: function() {
return this.rawWeatherData.hourly.data;
},
getSetHourlyTempInfoToday: function() {
var unixTime = this.rawWeatherData.currently.time;
var timezone = this.getTimezone();
var todayMonthDate = this.unixToHuman(timezone, unixTime).onlyMonthDate;
var hourlyData = this.getHourlyInfoToday();
for (var i = 0; i < hourlyData.length; i++) {
var hourlyTimeAllTypes = this.unixToHuman(timezone, hourlyData[i].time);
var hourlyOnlyTime = hourlyTimeAllTypes.onlyTime;
var hourlyMonthDate = hourlyTimeAllTypes.onlyMonthDate;
if (todayMonthDate === hourlyMonthDate) {
var hourlyObject = { hour: '', temp: '' };
hourlyObject.hour = hourlyOnlyTime;
hourlyObject.temp = this.fahToCel(hourlyData[i].temperature).toString();
this.tempVar.tempToday.push(hourlyObject);
/*
Since we are using array.push(), we are just adding elements
at the end of the array. Thus, the array is not getting emptied
first when a new location is entered.
to solve this problem, a method this.makeTempVarTodayEmpty()
has been created, and called from this.locationEntered().
*/
}
}
/*
To cover the edge case where the local time is between 10 — 12 PM,
and therefore there are only two elements in the array
this.tempVar.tempToday. We need to add the points for minimum temperature
and maximum temperature so that the chart gets generated with atleast four points.
*/
if (this.tempVar.tempToday.length <= 2) {
var minTempObject = {
hour: this.currentWeather.todayHighLow.todayTempHighTime,
temp: this.currentWeather.todayHighLow.todayTempHigh
};
var maxTempObject = {
hour: this.currentWeather.todayHighLow.todayTempLowTime,
temp: this.currentWeather.todayHighLow.todayTempLow
};
/*
Typically, lowest temp are at dawn,
highest temp is around mid day.
Thus we can safely arrange like min, max, temp after 10 PM.
*/
// array.unshift() adds stuff at the beginning of the array.
// the order will be: min, max, 10 PM, 11 PM.
this.tempVar.tempToday.unshift(maxTempObject, minTempObject);
}
},
// For Today Highlights
getSetUVIndex: function() {
var uvIndex = this.rawWeatherData.currently.uvIndex;
this.highlights.uvIndex = uvIndex;
},
getSetVisibility: function() {
var visibilityInMiles = this.rawWeatherData.currently.visibility;
this.highlights.visibility = this.mileToKilometer(visibilityInMiles);
},
getSetWindStatus: function() {
var windSpeedInMiles = this.rawWeatherData.currently.windSpeed;
this.highlights.windStatus.windSpeed = this.mileToKilometer(
windSpeedInMiles
);
var absoluteWindDir = this.rawWeatherData.currently.windBearing;
this.highlights.windStatus.windDirection = absoluteWindDir;
this.highlights.windStatus.derivedWindDirection = this.deriveWindDir(
absoluteWindDir
);
},
// top level for info section
organizeCurrentWeatherInfo: function() {
// data in this.currentWeather
/*
Coordinates and location is covered (get & set) in:
— this.getCoordinates()
— this.setFormatCoordinates()
There are lots of async-await involved there.
So it's better to keep them there.
*/
this.getSetCurrentTime();
this.getSetCurrentTemp();
this.getSetTodayTempHighLowWithTime();
this.getSetSummary();
this.getSetPossibility();
},
organizeTodayHighlights: function() {
// top level for highlights
this.getSetUVIndex();
this.getSetVisibility();
this.getSetWindStatus();
},
// topmost level orchestration
organizeAllDetails: async function() {
// top level organization
await this.fetchWeatherData();
this.organizeCurrentWeatherInfo();
this.organizeTodayHighlights();
this.getSetHourlyTempInfoToday();
},
},
mounted: async function() {
this.location = "New York";
await this.organizeAllDetails();
}
};
</script>
</code></pre>
</div>
<p>And finally, after so much of patience and hard work, you can see the data flow with its raw power! Visit the application on the browser, refresh the page, search for a location in the application’s search box, and hit <kbd>Enter</kbd>!</p>
<figure><a target="_blank" href="https://cloud.netlifyusercontent.com/assets/344dbf88-fdf9-42bb-adb4-46f01eedd629/a36c5478-9e55-4fc6-8725-0ab2e6af232b/interactive-weather-dashboard-image13.png"><br />
<img decoding="async" src="https://res.cloudinary.com/indysigner/image/fetch/f_auto,q_auto/w_400/https://cloud.netlifyusercontent.com/assets/344dbf88-fdf9-42bb-adb4-46f01eedd629/a36c5478-9e55-4fc6-8725-0ab2e6af232b/interactive-weather-dashboard-image13.png" alt="The application as shown in the browser"></a><figcaption>
(<a target="_blank" href="https://cloud.netlifyusercontent.com/assets/344dbf88-fdf9-42bb-adb4-46f01eedd629/a36c5478-9e55-4fc6-8725-0ab2e6af232b/interactive-weather-dashboard-image13.png">Large preview</a>)<br />
</figcaption></figure>
<p>Now that we are done with all the heavy lifting, take a break. The subsequent sections focus on using the data to create charts that are beautiful and informative, followed by giving our ugly looking application a much deserved grooming session using CSS.</p>
<h3>5. Data Visualization With FusionCharts</h3>
<h4>Fundamental Considerations For Charts</h4>
<p>For the end user, the essence of a dashboard is essentially this: a collection of the filtered and carefully curated information on a particular topic, conveyed through visual/graphic instruments for quick ingestion. They don’t care about the subtleties of your data pipeline engineering, or how aesthetic your code is — all they want is a high-level view in 3 seconds. Therefore, our crude application displaying text data means nothing to them, and it’s high time we implement mechanisms to wrap the data with charts.</p>
<p>However, before we dive deep into the implementation of charts, let’s consider some pertinent questions and the possible answers from our perspective:</p>
<ul>
<li><strong>What type of charts are appropriate for the type of data we are dealing with?</strong><br />
Well, the answer has two aspects — the context, and the purpose. By context, we mean the type of data, and it’s overall fit in the scheme of bigger things, bounded by the scope and audience of the project. And by purpose, we essentially mean “what we want to emphasize on?”. For example, we can represent today’s temperature at different times of the day by using a <a target="_blank" href="https://www.fusioncharts.com/charts/column-bar-charts/">Column chart</a> (vertical columns of equal width, with height proportional to the value the column represents). However, we are rarely interested in the individual values, but rather the overall variation and trend throughout the data. To suit the purpose, it is in our best interest to use a <a target="_blank" href="https://www.fusioncharts.com/dev/chart-guide/standard-charts/line-area-and-column-charts#line-chart-5">Line chart</a>, and we will do that shortly.</li>
<li><strong>What should be kept in mind before selecting a charting library?</strong><br />
Since we are doing a project predominantly using JavaScript based technologies, it’s a no-brainer that any charting library that we choose for our project should be a native of the JavaScript world. With that basic premise in mind, we should consider the following before zeroing down on any particular library:</p>
<ul>
<li><strong>Support for the frameworks of our choice</strong>, which in this case, is Vue.js. A project can be developed in other popular JavaScript frameworks like React, or Angular — check the support of the charting library for your favorite framework. Also, support for other popular programming languages like Python, Java, C++, .Net (AS and VB), especially when the project involves some serious backend stuff, must be considered.</li>
<li><strong>Availability of charts types and features</strong>, since it is almost impossible to know beforehand what will be final shape and purpose of the data in the project (especially if the requirements are regulated by your clients in a professional setting). In this case, you should cast your net wide, and choose a charting library that has the widest collection of charts. More importantly, to differentiate your project from others, the library should have have enough features in the form of configurable chart attributes, so that you can fine-tune and customize most aspects of the charts and the right level of granularity. Also, the default chart configurations should be sensible, and the library documentation has to be top notch, for reasons that’s obvious to professional developers.</li>
<li><strong>Learning curve, support community, and balance</strong> must also be taken into consideration, especially when you are new to data visualization. On one end of the spectrum, you have proprietary tools like Tableau and Qlickview that costs a bomb, has smooth learning curve, but also comes with so many limitations in terms of customizability, integration, and deployment. On the other end there is d3.js — vast, free (open source), and customizable to its core, but you have to pay the price of a very steep learning curve to be able to do anything productive with the library.</li>
</ul>
</li>
</ul>
<p><em>What you need is the sweet spot — the right balance between productivity, coverage, customizability, learning curve, and off course, cost. We nudge you to take a look at <a target="_blank" href="https://www.fusioncharts.com/?utm_source=smashing_mag&utm_medium=blog&utm_campaign=weather_dashboard_vue">FusionCharts</a> — the world’s most comprehensive and enterprise-ready JavaScript charting library for the web and mobile, that we will be using in this project for creating charts.</em></p>
<h4>Introduction To FusionCharts</h4>
<p>FusionCharts is used worldwide as the go-to JavaScript charting library by millions of developers spread across hundreds of countries around the globe. Technically, it’s as loaded and configurable as it can be, with support for integrating it with almost any popular tech stack used for web based projects. Using FusionCharts commercially requires a license, and you have to pay for the license depending on your use case (please contact sales if you are curious). However, we are using FusionCharts in this projects just to try out a few things, and therefore the non-licensed version (comes with a small watermark in your charts, and a few other restrictions). Using the non-licensed version is perfectly fine when you are trying out the charts and using it in your non-commercial or personal projects. If you have plans to deploy the application commercially, please ensure that you have a license from FusionCharts.</p>
<p>Since this is a project involving Vue.js, we will need two modules that needs to be installed, if not done earlier:</p>
<ul>
<li>The <code>fusioncharts</code> module, because it contains everything you will need for creating the charts</li>
<li>The <code>vue-fusioncharts</code> module, which is essentially a wrapper for fusioncharts, so that it can be used in a Vue.js project</li>
</ul>
<p>If you have not installed them earlier (as instructed in the third section), install them by executing the following command from the project’s root directory:</p>
<pre><code>npm install fusioncharts vue-fusioncharts --save
</code></pre>
<p>Next, ensure that the <code>src/main.js</code> file of the project has the following code (also mentioned in section 3):</p>
<div>
<pre><code>import Vue from 'vue';
import App from './App.vue';
import FusionCharts from 'fusioncharts';
import Charts from 'fusioncharts/fusioncharts.charts';
import Widgets from 'fusioncharts/fusioncharts.widgets';
import PowerCharts from 'fusioncharts/fusioncharts.powercharts';
import FusionTheme from 'fusioncharts/themes/fusioncharts.theme.fusion';
import VueFusionCharts from 'vue-fusioncharts';
Charts(FusionCharts);
PowerCharts(FusionCharts);
Widgets(FusionCharts);
FusionTheme(FusionCharts);
Vue.use(VueFusionCharts, FusionCharts);
new Vue({
el: '#app',
render: h => h(App)
})
</code></pre>
</div>
<p>Perhaps the most critical line in the above snippet is the following:</p>
<pre><code>Vue.use(VueFusionCharts, FusionCharts)
</code></pre>
<p>It instructs Vue to use the vue-fusioncharts module for making sense of many things in the project that are apparently not explicitly defined by us, but is defined in the module itself. Also, this type of statement implies <strong>global</strong> declaration, by which we mean that anywhere Vue encounters anything strange in the code of our project (things that we have not explicitly defined about using FusionCharts), it will at least look once in the vue-fusioncharts and fusioncharts node modules for their definitions, before throwing up errors. If we would have used FusionCharts in an isolated part of our project (not using it in almost all of the component files), then perhaps local declaration would have made more sense.</p>
<p>With that, you are all set to use FusionCharts in the project. We will be using quite a few variety of charts, the choice being dependent on the aspect of the weather data that we want to visualize. Also, we will get to see the interplay of data binding, custom components, and watchers in action.</p>
<h4>General Scheme For Using Fusioncharts In <code>.vue</code> Files</h4>
<p>In this section, we will explain the general idea of using FusionCharts for creating various charts in the <code>.vue</code> files. But first, let’s see the pseudocode that schematically illustrates the core idea.</p>
<pre><code><template>
<div>
<fusioncharts
:attribute_1="data_object_1"
:attribute_2="data_object_2"
…
…
...
>
</fusioncharts>
</div>
</template>
<script>
export default {
props: ["data_prop_received_by_the_component"],
components: {},
data() {
return {
data_object_1: "value_1",
data_object_2: "value_2",
…
…
};
},
methods: {},
computed: {},
watch: {
data_prop_received_by_the_component: {
handler: function() {
// some code/logic, mainly data manipulation based
},
deep: true
}
}
};
</script>
<style>
// component specific special CSS code here
</style>
</code></pre>
<p>Let’s understand different parts of the above pseudocode:</p>
<ul>
<li>In the <code></code>, within the top level <code>
<div></code> (that’s pretty much mandatory for the template HTML code of every component), we have the custom component <code></code>. We have the definition of the component contained in the <code>vue-fusioncharts</code> Node module that we have installed for this project. Internally, <code>vue-fusioncharts</code> relies on the <code>fusioncharts</code> module, which have also been installed. We imported the necessary modules and resolved their dependencies, instructed Vue to use the wrapper globally (throughout the project) in the <code>src/main.js</code> file, and therefore there is no lack of definition for the custom <code></code> component that we have used here. Also, the custom component has custom attributes, and each of the custom attribute is bound to a data object (and in turn, their values), by the <code>v-bind</code> directive, for which the shorthand is the colon (<code>:</code>) symbol. We will learn about the attributes and their associated data objects in a greater detail, when we discuss some of the specific charts used in this project.</li>
<li>In the <code></code>, first you declare the props that the component is supposed to receive, and then go on defining the data objects that are bounded to the attributes of <code></code>. The values assigned to the data objects are the values that the attributes of <code></code> pulls in, and the charts are created on the basis of those pulled in values. Apart from these, the most interesting part of the code is the <code>watch { }</code> object. This is a very special object in Vue’s scheme of things — it essentially instructs Vue to watch over any changes happening to certain data, and then take actions based on how the <code>handler</code> function for that data has been defined. For example, we want Vue to keep a watch on the <code>prop</code> received, i.e., <code>data_prop_received_by_the_component</code> in the pseudocode. The <code>prop</code> becomes a key in the <code>watch { }</code> object, and the value of the key is another object — a handler method that describes what needs to be done whenever the <code>prop</code> changes. With such elegant mechanisms to handle the changes, the app maintains its reactivity. The <code>deep: true</code> represents a boolean flag that you can associate with watchers, so that the object being watched is watched rather deeply, i.e., even the changes made in the nested levels of the object are tracked.<br />
(<em>For more information on watchers, consult the <a target="_blank" href="https://vuejs.org/v2/api/#vm-watch">official documentation</a></em>).</li>
</ul>
<p>Now that you are equipped with an understanding of the general scheme of things, let’s dive into the specific implementations of the charts in the <code>.vue</code> component files. The code will be pretty self-explanatory, and you should try to understand how the specifics fit in the general scheme of things described above.</p>
<h4>Implementation Of Charts In .vue Files</h4>
<p>While the very specifics of the implementation varies from one chart to another, the following explanation is applicable for all of them:</p>
<ul>
<li><code></code><br />
As explained previously, the <code></code> custom component has several attributes, each of them being bound to corresponding data object defined in the <code>data()</code> function by using the <code>v-bind</code>: directive. The attribute names are quite self-explanatory for what they mean, and figuring out the corresponding data objects is also trivial.</li>
<li><code></code><br />
In the <code>data()</code> function, the data objects and their values are what makes the charts work, because of the binding done by the <code>v-bind</code> (<code>:</code>) directives used on the attributes of <code></code>. Before we dive deep into the individual data objects, it’s worth mentioning some general characteristics:</p>
<ul>
<li>The data objects whose values are either <code>0</code> or <code>1</code> are boolean in nature, where <code>0</code> represents something not available/turned off, and <code>1</code> represents availability/turned on state. However, be cautious that non-boolean data objects can also have <code>0</code> or <code>1</code> as their values, besides other possible values — it depends on the context. For example, <code>containerbackgroundopacity</code> with its default value as <code>0</code> is boolean, whereas <code>lowerLimit</code> with its default value as <code>0</code> simply means the number zero is its literal value.</li>
<li>Some data objects deals with CSS properties like margin, padding, font-size, etc. — the value has an implied unit of “px” or pixel. Similarly, other data objects can have implicit units associated with their values. For detailed information, please refer to the respective chart attributes page of FusionCharts Dev Center.</li>
</ul>
</li>
<li>In the <code>data()</code> function, perhaps the most interesting and non-obvious object is the dataSource. This object has three main objects nested within it:
<ul>
<li><strong>chart</strong>: This object encapsulates lots of chart attributes related to the configuration and cosmetics of the chart. It is almost a compulsory construct that you will find in all the charts you will create for this project.</li>
<li><strong>colorrange</strong>: This object is somewhat specific to the chart under consideration, and is mainly present in charts that deals with multiple colors/shades to demarcate different sub-ranges of the scale used in chart.</li>
<li>value: This object, again, is present in charts that has a specific value that needs to be highlighted in the range of the scale.</li>
</ul>
</li>
<li>The <code>watch { }</code> object is perhaps the most crucial thing that makes this chart, and the other charts used in this project, spring to life. The reactivity of the charts, i.e., the charts updating themselves based on the new values resulting from a new user query is controlled by the watchers defined in this object. For example, we have defined a watcher for the prop <code>highlights</code> received by the component, and then defined a handler function to instruct Vue about the necessary actions that it should take, when anything changes about the object being watched in the entire project. This means that whenever <code>App.vue</code> yields a new value for any of the object within <code>highlights</code>, the information trickles down all the way down to this component, and the new value is updated in the data objects of this component. The chart being bound to the values, also gets updated as a result of this mechanism.</li>
</ul>
<p>The above explanations are quite broad strokes to help us develop an intuitive understanding of the bigger picture. Once you understand the concepts intuitively, you can always consult the documentation of Vue.js and FusionCharts, when something is not clear to you from the code itself. We leave the exercise to you, and from the next subsection onward, we will not explain stuff that we covered in this subsection.</p>
<h5>src/components/TempVarChart.vue</h5>
<figure><a target="_blank" href="https://cloud.netlifyusercontent.com/assets/344dbf88-fdf9-42bb-adb4-46f01eedd629/18ac2859-3c79-4e90-b903-2404db7e69a0/interactive-weather-dashboard-image14.png"><br />
<img decoding="async" src="https://res.cloudinary.com/indysigner/image/fetch/f_auto,q_auto/w_400/https://cloud.netlifyusercontent.com/assets/344dbf88-fdf9-42bb-adb4-46f01eedd629/18ac2859-3c79-4e90-b903-2404db7e69a0/interactive-weather-dashboard-image14.png" alt="A diagram showing Hourly Temperature"></a><figcaption>
(<a target="_blank" href="https://cloud.netlifyusercontent.com/assets/344dbf88-fdf9-42bb-adb4-46f01eedd629/18ac2859-3c79-4e90-b903-2404db7e69a0/interactive-weather-dashboard-image14.png">Large preview</a>)<br />
</figcaption></figure>
<div>
<pre><code><template>
<div class="custom-card header-card card">
<div class="card-body pt-0">
<fusioncharts
type="spline"
width="100%"
height="100%"
dataformat="json" dataEmptyMessage="i-https://i.postimg.cc/R0QCk9vV/Rolling-0-9s-99px.gif"
dataEmptyMessageImageScale=39
:datasource="tempChartData"
>
</fusioncharts>
</div>
</div>
</template>
<script>
export default {
props: ["tempVar"],
components: {},
data() {
return {
tempChartData: {
chart: {
caption: "Hourly Temperature",
captionFontBold: "0",
captionFontColor: "#000000",
captionPadding: "30",
baseFont: "Roboto",
chartTopMargin: "30",
showHoverEffect: "1",
theme: "fusion",
showaxislines: "1",
numberSuffix: "°C",
anchorBgColor: "#6297d9",
paletteColors: "#6297d9",
drawCrossLine: "1",
plotToolText: "$label<br><hr><b>$dataValue</b>",
showAxisLines: "0",
showYAxisValues: "0",
anchorRadius: "4",
divLineAlpha: "0",
labelFontSize: "13",
labelAlpha: "65",
labelFontBold: "0",
rotateLabels: "1",
slantLabels: "1",
canvasPadding: "20"
},
data: [],
},
};
},
methods: {
setChartData: function() {
var data = [];
for (var i = 0; i < this.tempVar.tempToday.length; i++) {
var dataObject = {
label: this.tempVar.tempToday[i].hour,
value: this.tempVar.tempToday[i].temp
};
data.push(dataObject);
}
this.tempChartData.data = data;
},
},
mounted: function() {
this.setChartData();
},
watch: {
tempVar: {
handler: function() {
this.setChartData();
},
deep: true
},
},
};
</script>
<style>
</style>
</code></pre>
</div>
<h5>src/components/UVIndex.vue</h5>
<p>This component contains an extremely useful chart — the Angular Gauge.</p>
<figure><a target="_blank" href="https://cloud.netlifyusercontent.com/assets/344dbf88-fdf9-42bb-adb4-46f01eedd629/c958d43b-e6c4-47ba-8c01-e049749f0248/interactive-weather-dashboard-image15.png"><br />
<img decoding="async" src="https://res.cloudinary.com/indysigner/image/fetch/f_auto,q_auto/w_400/https://cloud.netlifyusercontent.com/assets/344dbf88-fdf9-42bb-adb4-46f01eedd629/c958d43b-e6c4-47ba-8c01-e049749f0248/interactive-weather-dashboard-image15.png" alt="UV Index"></a><figcaption>
(<a target="_blank" href="https://cloud.netlifyusercontent.com/assets/344dbf88-fdf9-42bb-adb4-46f01eedd629/c958d43b-e6c4-47ba-8c01-e049749f0248/interactive-weather-dashboard-image15.png">Large preview</a>)<br />
</figcaption></figure>
<p>The code for the component is given below. For detailed information on the chart attributes of Angular Gauge, refer to <a target="_blank" href="https://www.fusioncharts.com/dev/chart-guide/gauges-and-widgets/angular-gauge?utm_source=smashing_mag&utm_medium=blog&utm_campaign=weather_dashboard_vue">FusionCharts Dev Center page for Angular Gauge</a>.</p>
<div>
<pre><code><template>
<div class="highlights-item col-md-4 col-sm-6 col-xs-12 border-top">
<div>
<fusioncharts
:type="type"
:width="width"
:height="height"
:containerbackgroundopacity="containerbackgroundopacity"
:dataformat="dataformat"
:datasource="datasource"
></fusioncharts>
</div>
</div>
</template>
<script>
export default {
props: ["highlights"],
components: {},
data() {
return {
type: "angulargauge",
width: "100%",
height: "100%",
containerbackgroundopacity: 0,
dataformat: "json",
datasource: {
chart: {
caption: "UV Index",
captionFontBold: "0",
captionFontColor: "#000000",
captionPadding: "30",
lowerLimit: "0",
upperLimit: "15",
lowerLimitDisplay: "1",
upperLimitDisplay: "1",
showValue: "0",
theme: "fusion",
baseFont: "Roboto",
bgAlpha: "0",
canvasbgAlpha: "0",
gaugeInnerRadius: "75",
gaugeOuterRadius: "110",
pivotRadius: "0",
pivotFillAlpha: "0",
valueFontSize: "20",
valueFontColor: "#000000",
valueFontBold: "1",
tickValueDistance: "3",
autoAlignTickValues: "1",
majorTMAlpha: "20",
chartTopMargin: "30",
chartBottomMargin: "40"
},
colorrange: {
color: [
{
minvalue: "0",
maxvalue: this.highlights.uvIndex.toString(),
code: "#7DA9E0"
},
{
minvalue: this.highlights.uvIndex.toString(),
maxvalue: "15",
code: "#D8EDFF"
}
]
},
annotations: {
groups: [
{
items: [
{
id: "val-label",
type: "text",
text: this.highlights.uvIndex.toString(),
fontSize: "20",
font: "Source Sans Pro",
fontBold: "1",
fillcolor: "#212529",
x: "$gaugeCenterX",
y: "$gaugeCenterY"
}
]
}
]
},
dials: {
dial: [
{
value: this.highlights.uvIndex.toString(),
baseWidth: "0",
radius: "0",
borderThickness: "0",
baseRadius: "0"
}
]
}
}
};
},
methods: {},
computed: {},
watch: {
highlights: {
handler: function() {
this.datasource.colorrange.color[0].maxvalue = this.highlights.uvIndex.toString();
this.datasource.colorrange.color[1].minvalue = this.highlights.uvIndex.toString();
this.datasource.annotations.groups[0].items[0].text = this.highlights.uvIndex.toString();
},
deep: true
}
}
};
</script>
</code></pre>
</div>
<h5>src/components/Visibility.vue</h5>
<p>In this component, we use a <a target="_blank" href="https://www.fusioncharts.com/dev/chart-guide/gauges-and-widgets/linear-gauge">Horizontal Linear Gauge</a> to represent the visibility, as shown in the image below:</p>
<figure><a target="_blank" href="https://cloud.netlifyusercontent.com/assets/344dbf88-fdf9-42bb-adb4-46f01eedd629/205825ff-05a5-41d7-aa81-cd0a9eab5d21/interactive-weather-dashboard-image16.png"><br />
<img decoding="async" src="https://res.cloudinary.com/indysigner/image/fetch/f_auto,q_auto/w_400/https://cloud.netlifyusercontent.com/assets/344dbf88-fdf9-42bb-adb4-46f01eedd629/205825ff-05a5-41d7-aa81-cd0a9eab5d21/interactive-weather-dashboard-image16.png" alt="A screenshot of the Horizontal Linear Gauge representing Air Visibility (16km)"></a><figcaption>
(<a target="_blank" href="https://cloud.netlifyusercontent.com/assets/344dbf88-fdf9-42bb-adb4-46f01eedd629/205825ff-05a5-41d7-aa81-cd0a9eab5d21/interactive-weather-dashboard-image16.png">Large preview</a>)<br />
</figcaption></figure>
<p>The code for the component is given below. For an in depth understanding of the different attributes of this chart type, please refer to <a target="_blank" href="https://www.fusioncharts.com/dev/chart-attributes/?chart=HLinearGauge&utm_source=smashing_mag&utm_medium=blog&utm_campaign=weather_dashboard_vue">FusionCharts Dev Center page for Horizontal Linear Gauge</a>.</p>
<div>
<pre><code><template>
<div class="highlights-item col-md-4 col-sm-6 col-xs-12 border-left border-right border-top">
<div>
<fusioncharts
:type="type"
:width="width"
:height="height"
:containerbackgroundopacity="containerbackgroundopacity"
:dataformat="dataformat"
:datasource="datasource"
>
</fusioncharts>
</div>
</div>
</template>
<script>
export default {
props: ["highlights"],
components: {},
methods: {},
computed: {},
data() {
return {
type: "hlineargauge",
width: "100%",
height: "100%",
containerbackgroundopacity: 0,
dataformat: "json",
creditLabel: false,
datasource: {
chart: {
caption: "Air Visibility",
captionFontBold: "0",
captionFontColor: "#000000",
baseFont: "Roboto",
numberSuffix: " km",
lowerLimit: "0",
upperLimit: "40",
showPointerShadow: "1",
animation: "1",
transposeAnimation: "1",
theme: "fusion",
bgAlpha: "0",
canvasBgAlpha: "0",
valueFontSize: "20",
valueFontColor: "#000000",
valueFontBold: "1",
pointerBorderAlpha: "0",
chartBottomMargin: "40",
captionPadding: "30",
chartTopMargin: "30"
},
colorRange: {
color: [
{
minValue: "0",
maxValue: "4",
label: "Fog",
code: "#6297d9"
},
{
minValue: "4",
maxValue: "10",
label: "Haze",
code: "#7DA9E0"
},
{
minValue: "10",
maxValue: "40",
label: "Clear",
code: "#D8EDFF"
}
]
},
pointers: {
pointer: [
{
value: this.highlights.visibility.toString()
}
]
}
}
};
},
watch: {
highlights: {
handler: function() {
this.datasource.pointers.pointer[0].value = this.highlights.visibility.toString();
},
deep: true
}
}
};
</script>
</code></pre>
</div>
<h5>src/components/WindStatus.vue</h5>
<p>This component displays the wind speed and direction (wind velocity, if you are physics savvy), and it is very difficult to represent a vector using a chart. For such cases, we suggest representing them with the aid of some nice images and text values. Since the representation we have thought about is entirely dependent on CSS, we will implement it in the next section that deals with the CSS. However, take a look at what we are aiming to create:</p>
<figure><a target="_blank" href="https://cloud.netlifyusercontent.com/assets/344dbf88-fdf9-42bb-adb4-46f01eedd629/cdf9ab00-3ccc-473b-82f6-ab517c7bf412/interactive-weather-dashboard-image17.png"><br />
<img decoding="async" src="https://res.cloudinary.com/indysigner/image/fetch/f_auto,q_auto/w_400/https://cloud.netlifyusercontent.com/assets/344dbf88-fdf9-42bb-adb4-46f01eedd629/cdf9ab00-3ccc-473b-82f6-ab517c7bf412/interactive-weather-dashboard-image17.png" alt="Wind Status: Wind Direction (left) and Wind Speed (right)"></a><figcaption>
(<a target="_blank" href="https://cloud.netlifyusercontent.com/assets/344dbf88-fdf9-42bb-adb4-46f01eedd629/cdf9ab00-3ccc-473b-82f6-ab517c7bf412/interactive-weather-dashboard-image17.png">Large preview</a>)<br />
</figcaption></figure>
<div>
<pre><code><template>
<div class="highlights-item col-md-4 col-sm-6 col-xs-12 border-top">
<div>
<div class="card-heading pt-5">Wind Status</div>
<div class="row pt-4 mt-4">
<div class="col-sm-6 col-md-6 mt-2 text-center align-middle">
<p class="card-sub-heading mt-3">Wind Direction</p>
<p class="mt-4"><img src="../assets/winddirection.svg" height="40" width="40"></p>
<p class="card-value mt-4">{{ highlights.windStatus.derivedWindDirection }}</p>
</div>
<div class="col-sm-6 col-md-6 mt-2">
<p class="card-sub-heading mt-3">Wind Speed</p>
<p class="mt-4"><img src="../assets/windspeed.svg" height="40" width="40"></p>
<p class="card-value mt-4">{{ highlights.windStatus.windSpeed }} km/h</p>
</div>
</div>
</div>
</div>
</template>
<script>
export default {
props: ["highlights"],
components: {},
data() {
return {};
},
methods: {},
computed: {}
};
</script>
</code></pre>
</div>
<h4>Wrapping Up With Highlights.vue</h4>
<p>Recall that we have already implemented code with CSS for all the components — except <code>Content.vue</code> and <code>Highlights.vue</code>. Since <code>Content.vue</code> is a dumb component that just relays data, the minimal styling it needs has already been covered. Also, we have already written appropriate code for styling the sidebar and the cards containing the charts. Therefore, all we are left to do is add some stylistic bits to <code>Highlights.vue</code>, which primarily involves using the CSS classes:</p>
<div>
<pre><code><template>
<div class="custom-content-card content-card card">
<div class="card-body pb-0">
<div class="content-header h4 text-center pt-2 pb-3">Highlights</div>
<div class="row">
<uv-index :highlights="highlights"></uv-index>
<visibility :highlights="highlights"></visibility>
<wind-status :highlights="highlights"></wind-status>
</div>
</div>
</div>
</template>
<script>
import UVIndex from "./UVIndex.vue";
import Visibility from "./Visibility.vue";
import WindStatus from "./WindStatus.vue";
export default {
props: ["highlights"],
components: {
"uv-index": UVIndex,
"visibility": Visibility,
"wind-status": WindStatus,
},
};
</script>
</code></pre>
</div>
<h4>Deployment And Source Code</h4>
<p>With the charts and style in order, we are done! Take a moment to appreciate the beauty of your creation.</p>
<figure><a target="_blank" href="https://cloud.netlifyusercontent.com/assets/344dbf88-fdf9-42bb-adb4-46f01eedd629/c538b1aa-2c4d-4dd7-8d27-6d0db227ee7c/interactive-weather-dashboard-image18.png"><br />
<img decoding="async" src="https://res.cloudinary.com/indysigner/image/fetch/f_auto,q_auto/w_400/https://cloud.netlifyusercontent.com/assets/344dbf88-fdf9-42bb-adb4-46f01eedd629/c538b1aa-2c4d-4dd7-8d27-6d0db227ee7c/interactive-weather-dashboard-image18.png" alt="The result"></a><figcaption>
(<a target="_blank" href="https://cloud.netlifyusercontent.com/assets/344dbf88-fdf9-42bb-adb4-46f01eedd629/c538b1aa-2c4d-4dd7-8d27-6d0db227ee7c/interactive-weather-dashboard-image18.png">Large preview</a>)<br />
</figcaption></figure>
<p>It’s now time for you to deploy your application, and share it with your peers. If you don’t have much idea about deployment and expect us to help you, look <a target="_blank" href="https://www.fusioncharts.com/resources/developers/charting-react-vs-vue-npm-battle-tutorial#production-deployment">here about our take on deployment ideas</a>. The linked article also contains suggestions on how to remove the FusionCharts watermark at the left bottom of every chart.</p>
<p>If you mess up somewhere and want a reference point, the <a target="_blank" href="https://github.com/datasouvik/modified_weather_dashboard">source code is available on Github</a>.</p>
<div>
<span>(ms, ra, il)</span>
</div>
</article>
<div class="fixed"></div>
</div>
<div class="under">
<span class="categories">Categories: </span><span><a href="http://www.webmastersgallery.com/category/uncategorized/" rel="category tag">Others</a></span> <span class="tags">Tags: </span><span></span> </div>
</div>
<!-- related posts START -->
<!-- related posts END -->
<script type="text/javascript" src="http://www.webmastersgallery.com/wp-content/themes/inove/js/comment.js"></script>
<div id="comments">
<div id="cmtswitcher">
<a id="commenttab" class="curtab" href="javascript:void(0);" onclick="MGJS.switchTab('thecomments,commentnavi', 'thetrackbacks', 'commenttab', 'curtab', 'trackbacktab', 'tab');">Comments (0)</a>
<a id="trackbacktab" class="tab" href="javascript:void(0);" onclick="MGJS.switchTab('thetrackbacks', 'thecomments,commentnavi', 'trackbacktab', 'curtab', 'commenttab', 'tab');">Trackbacks (0)</a>
<span class="addcomment"><a href="#respond">Leave a comment</a></span>
<span class="addtrackback"><a href="http://www.webmastersgallery.com/2019/02/01/using-vue-js-to-create-an-interactive-weather-dashboard-with-apis/trackback/">Trackback</a></span>
<div class="fixed"></div>
</div>
<div id="commentlist">
<!-- comments START -->
<ol id="thecomments">
<li class="messagebox">
No comments yet. </li>
</ol>
<!-- comments END -->
<!-- trackbacks START -->
<ol id="thetrackbacks">
<li class="messagebox">
No trackbacks yet. </li>
</ol>
<div class="fixed"></div>
<!-- trackbacks END -->
</div>
</div>
<div id="comment_login" class="messagebox">
You must be <a href="http://www.webmastersgallery.com/wp-login.php">logged in</a> to post a comment. </div>
<div id="postnavi">
<span class="prev"><a href="http://www.webmastersgallery.com/2019/02/01/deal-huge-discount-on-samantha-craft-font/" rel="next">Deal: Huge Discount on Samantha Craft Font</a></span>
<span class="next"><a href="http://www.webmastersgallery.com/2019/02/01/5-best-ssh-terminal-apps-for-iphone-manage-your-cloud-project-on-the-go/" rel="prev">5 Best SSH Terminal Apps for iPhone – Manage your Cloud Project on the Go</a></span>
<div class="fixed"></div>
</div>
</div>
<!-- main END -->
<!-- sidebar START -->
<div id="sidebar">
<!-- sidebar north START -->
<div id="northsidebar" class="sidebar">
<!-- feeds -->
<div class="widget widget_feeds">
<div class="content">
<div id="subscribe">
<a rel="external nofollow" id="feedrss" title="Subscribe to this blog..." href="http://www.webmastersgallery.com/feed/"><abbr title="Really Simple Syndication">RSS</abbr></a>
</div>
<div class="fixed"></div>
</div>
</div>
<!-- showcase -->
<div id="text-389627311" class="widget widget_text"> <div class="textwidget"><a href="http://feeds2.feedburner.com/webmastersgallery" title="Subscribe to my feed" rel="alternate" type="application/rss+xml"><img src="http://www.feedburner.com/fb/images/pub/feed-icon32x32.png" alt="" style="border:0"/></a><a href="http://feeds2.feedburner.com/webmastersgallery" title="Subscribe to my feed" rel="alternate" type="application/rss+xml">Subscribe for latest Updates</a></div>
</div><div id="text-389629461" class="widget widget_text"> <div class="textwidget"><form style="border:1px solid #ccc;padding:3px;text-align:center;" action="http://feedburner.google.com/fb/a/mailverify" method="post" target="popupwindow" onsubmit="window.open('http://feedburner.google.com/fb/a/mailverify?uri=webmastersgallery', 'popupwindow', 'scrollbars=yes,width=550,height=520');return true"><p>Enter your email address:</p><p><input type="text" style="width:140px" name="email"/></p><input type="hidden" value="webmastersgallery" name="uri"/><input type="hidden" name="loc" value="en_US"/><input type="submit" value="Subscribe" /><p>Delivered by <a href="http://feedburner.google.com" target="_blank" rel="noopener">FeedBurner</a></p></form></div>
</div></div>
<!-- sidebar north END -->
<div id="centersidebar">
<!-- sidebar east START -->
<div id="eastsidebar" class="sidebar">
<!-- categories -->
<div class="widget widget_categories">
<h3>Categories</h3>
<ul>
<li class="cat-item cat-item-518"><a href="http://www.webmastersgallery.com/category/affiliate-programs/">Affiliate Programs</a>
</li>
<li class="cat-item cat-item-147"><a href="http://www.webmastersgallery.com/category/design/">Designing</a>
</li>
<li class="cat-item cat-item-519"><a href="http://www.webmastersgallery.com/category/domain-names/">Domain Names</a>
</li>
<li class="cat-item cat-item-37"><a href="http://www.webmastersgallery.com/category/e-commerce/">E-commerce</a>
</li>
<li class="cat-item cat-item-509"><a href="http://www.webmastersgallery.com/category/internet-directories/">Internet Directories</a>
</li>
<li class="cat-item cat-item-510"><a href="http://www.webmastersgallery.com/category/message-boards/">Message Boards</a>
</li>
<li class="cat-item cat-item-1"><a href="http://www.webmastersgallery.com/category/uncategorized/">Others</a>
</li>
<li class="cat-item cat-item-506"><a href="http://www.webmastersgallery.com/category/programming/">Programming</a>
</li>
<li class="cat-item cat-item-511"><a href="http://www.webmastersgallery.com/category/promotion-and-marketing/">Promotion and Marketing</a>
</li>
<li class="cat-item cat-item-534"><a href="http://www.webmastersgallery.com/category/scripts-and-programming/">Scripts and Programming</a>
</li>
<li class="cat-item cat-item-513"><a href="http://www.webmastersgallery.com/category/search-engines/">Search Engines</a>
</li>
<li class="cat-item cat-item-135"><a href="http://www.webmastersgallery.com/category/social-media/">Social Media</a>
</li>
<li class="cat-item cat-item-514"><a href="http://www.webmastersgallery.com/category/softwares/">Softwares</a>
</li>
<li class="cat-item cat-item-515"><a href="http://www.webmastersgallery.com/category/tips-and-tutorials/">Tips and Tutorials</a>
</li>
<li class="cat-item cat-item-338"><a href="http://www.webmastersgallery.com/category/web-hosting/">Web Hosting</a>
</li>
<li class="cat-item cat-item-516"><a href="http://www.webmastersgallery.com/category/webmaster-tools/">Webmaster Tools</a>
</li>
<li class="cat-item cat-item-501"><a href="http://www.webmastersgallery.com/category/webmaster-resources/">Webmasters Resources</a>
</li>
<li class="cat-item cat-item-3"><a href="http://www.webmastersgallery.com/category/web-design/">Website Design</a>
</li>
</ul>
</div>
</div>
<!-- sidebar east END -->
<!-- sidebar west START -->
<div id="westsidebar" class="sidebar">
<!-- blogroll -->
<div class="widget widget_links">
<h3>Blogroll</h3>
<ul>
<li><a href="http://wordpress.org/development/">Development Blog</a></li>
<li><a href="http://codex.wordpress.org/">Documentation</a></li>
<li><a href="http://wordpress.org/extend/plugins/">Plugins</a></li>
<li><a href="http://wordpress.org/extend/ideas/">Suggest Ideas</a></li>
<li><a href="http://wordpress.org/support/">Support Forum</a></li>
<li><a href="http://wordpress.org/extend/themes/">Themes</a></li>
<li><a href="http://planet.wordpress.org/">WordPress Planet</a></li>
</ul>
</div>
</div>
<!-- sidebar west END -->
<div class="fixed"></div>
</div>
<!-- sidebar south START -->
<div id="southsidebar" class="sidebar">
<!-- archives -->
<div class="widget">
<h3>Archives</h3>
<ul>
<li><a href='http://www.webmastersgallery.com/2024/04/'>April 2024</a></li>
<li><a href='http://www.webmastersgallery.com/2024/03/'>March 2024</a></li>
<li><a href='http://www.webmastersgallery.com/2024/02/'>February 2024</a></li>
<li><a href='http://www.webmastersgallery.com/2024/01/'>January 2024</a></li>
<li><a href='http://www.webmastersgallery.com/2023/12/'>December 2023</a></li>
<li><a href='http://www.webmastersgallery.com/2023/11/'>November 2023</a></li>
<li><a href='http://www.webmastersgallery.com/2023/10/'>October 2023</a></li>
<li><a href='http://www.webmastersgallery.com/2023/09/'>September 2023</a></li>
<li><a href='http://www.webmastersgallery.com/2023/08/'>August 2023</a></li>
<li><a href='http://www.webmastersgallery.com/2023/07/'>July 2023</a></li>
<li><a href='http://www.webmastersgallery.com/2023/06/'>June 2023</a></li>
<li><a href='http://www.webmastersgallery.com/2023/05/'>May 2023</a></li>
<li><a href='http://www.webmastersgallery.com/2023/04/'>April 2023</a></li>
<li><a href='http://www.webmastersgallery.com/2023/03/'>March 2023</a></li>
<li><a href='http://www.webmastersgallery.com/2023/02/'>February 2023</a></li>
<li><a href='http://www.webmastersgallery.com/2023/01/'>January 2023</a></li>
<li><a href='http://www.webmastersgallery.com/2022/12/'>December 2022</a></li>
<li><a href='http://www.webmastersgallery.com/2022/11/'>November 2022</a></li>
<li><a href='http://www.webmastersgallery.com/2022/10/'>October 2022</a></li>
<li><a href='http://www.webmastersgallery.com/2022/09/'>September 2022</a></li>
<li><a href='http://www.webmastersgallery.com/2022/08/'>August 2022</a></li>
<li><a href='http://www.webmastersgallery.com/2022/07/'>July 2022</a></li>
<li><a href='http://www.webmastersgallery.com/2022/06/'>June 2022</a></li>
<li><a href='http://www.webmastersgallery.com/2022/05/'>May 2022</a></li>
<li><a href='http://www.webmastersgallery.com/2022/04/'>April 2022</a></li>
<li><a href='http://www.webmastersgallery.com/2022/03/'>March 2022</a></li>
<li><a href='http://www.webmastersgallery.com/2022/02/'>February 2022</a></li>
<li><a href='http://www.webmastersgallery.com/2022/01/'>January 2022</a></li>
<li><a href='http://www.webmastersgallery.com/2021/12/'>December 2021</a></li>
<li><a href='http://www.webmastersgallery.com/2021/11/'>November 2021</a></li>
<li><a href='http://www.webmastersgallery.com/2021/10/'>October 2021</a></li>
<li><a href='http://www.webmastersgallery.com/2021/09/'>September 2021</a></li>
<li><a href='http://www.webmastersgallery.com/2021/08/'>August 2021</a></li>
<li><a href='http://www.webmastersgallery.com/2021/07/'>July 2021</a></li>
<li><a href='http://www.webmastersgallery.com/2021/06/'>June 2021</a></li>
<li><a href='http://www.webmastersgallery.com/2021/05/'>May 2021</a></li>
<li><a href='http://www.webmastersgallery.com/2021/04/'>April 2021</a></li>
<li><a href='http://www.webmastersgallery.com/2021/03/'>March 2021</a></li>
<li><a href='http://www.webmastersgallery.com/2021/02/'>February 2021</a></li>
<li><a href='http://www.webmastersgallery.com/2021/01/'>January 2021</a></li>
<li><a href='http://www.webmastersgallery.com/2020/12/'>December 2020</a></li>
<li><a href='http://www.webmastersgallery.com/2020/11/'>November 2020</a></li>
<li><a href='http://www.webmastersgallery.com/2020/10/'>October 2020</a></li>
<li><a href='http://www.webmastersgallery.com/2020/09/'>September 2020</a></li>
<li><a href='http://www.webmastersgallery.com/2020/08/'>August 2020</a></li>
<li><a href='http://www.webmastersgallery.com/2020/07/'>July 2020</a></li>
<li><a href='http://www.webmastersgallery.com/2020/06/'>June 2020</a></li>
<li><a href='http://www.webmastersgallery.com/2020/05/'>May 2020</a></li>
<li><a href='http://www.webmastersgallery.com/2020/04/'>April 2020</a></li>
<li><a href='http://www.webmastersgallery.com/2020/03/'>March 2020</a></li>
<li><a href='http://www.webmastersgallery.com/2020/02/'>February 2020</a></li>
<li><a href='http://www.webmastersgallery.com/2020/01/'>January 2020</a></li>
<li><a href='http://www.webmastersgallery.com/2019/12/'>December 2019</a></li>
<li><a href='http://www.webmastersgallery.com/2019/11/'>November 2019</a></li>
<li><a href='http://www.webmastersgallery.com/2019/10/'>October 2019</a></li>
<li><a href='http://www.webmastersgallery.com/2019/09/'>September 2019</a></li>
<li><a href='http://www.webmastersgallery.com/2019/08/'>August 2019</a></li>
<li><a href='http://www.webmastersgallery.com/2019/07/'>July 2019</a></li>
<li><a href='http://www.webmastersgallery.com/2019/06/'>June 2019</a></li>
<li><a href='http://www.webmastersgallery.com/2019/05/'>May 2019</a></li>
<li><a href='http://www.webmastersgallery.com/2019/04/'>April 2019</a></li>
<li><a href='http://www.webmastersgallery.com/2019/03/'>March 2019</a></li>
<li><a href='http://www.webmastersgallery.com/2019/02/'>February 2019</a></li>
<li><a href='http://www.webmastersgallery.com/2019/01/'>January 2019</a></li>
<li><a href='http://www.webmastersgallery.com/2018/12/'>December 2018</a></li>
<li><a href='http://www.webmastersgallery.com/2018/11/'>November 2018</a></li>
<li><a href='http://www.webmastersgallery.com/2018/10/'>October 2018</a></li>
<li><a href='http://www.webmastersgallery.com/2018/09/'>September 2018</a></li>
<li><a href='http://www.webmastersgallery.com/2018/08/'>August 2018</a></li>
<li><a href='http://www.webmastersgallery.com/2018/07/'>July 2018</a></li>
<li><a href='http://www.webmastersgallery.com/2018/04/'>April 2018</a></li>
<li><a href='http://www.webmastersgallery.com/2018/01/'>January 2018</a></li>
<li><a href='http://www.webmastersgallery.com/2017/12/'>December 2017</a></li>
<li><a href='http://www.webmastersgallery.com/2017/11/'>November 2017</a></li>
<li><a href='http://www.webmastersgallery.com/2017/09/'>September 2017</a></li>
<li><a href='http://www.webmastersgallery.com/2017/08/'>August 2017</a></li>
<li><a href='http://www.webmastersgallery.com/2017/07/'>July 2017</a></li>
<li><a href='http://www.webmastersgallery.com/2017/06/'>June 2017</a></li>
<li><a href='http://www.webmastersgallery.com/2017/05/'>May 2017</a></li>
<li><a href='http://www.webmastersgallery.com/2017/04/'>April 2017</a></li>
<li><a href='http://www.webmastersgallery.com/2017/03/'>March 2017</a></li>
<li><a href='http://www.webmastersgallery.com/2017/02/'>February 2017</a></li>
<li><a href='http://www.webmastersgallery.com/2017/01/'>January 2017</a></li>
<li><a href='http://www.webmastersgallery.com/2016/12/'>December 2016</a></li>
<li><a href='http://www.webmastersgallery.com/2016/11/'>November 2016</a></li>
<li><a href='http://www.webmastersgallery.com/2016/10/'>October 2016</a></li>
<li><a href='http://www.webmastersgallery.com/2016/09/'>September 2016</a></li>
<li><a href='http://www.webmastersgallery.com/2016/08/'>August 2016</a></li>
<li><a href='http://www.webmastersgallery.com/2016/07/'>July 2016</a></li>
<li><a href='http://www.webmastersgallery.com/2016/06/'>June 2016</a></li>
<li><a href='http://www.webmastersgallery.com/2016/05/'>May 2016</a></li>
<li><a href='http://www.webmastersgallery.com/2016/04/'>April 2016</a></li>
<li><a href='http://www.webmastersgallery.com/2016/03/'>March 2016</a></li>
<li><a href='http://www.webmastersgallery.com/2016/02/'>February 2016</a></li>
<li><a href='http://www.webmastersgallery.com/2016/01/'>January 2016</a></li>
<li><a href='http://www.webmastersgallery.com/2015/12/'>December 2015</a></li>
<li><a href='http://www.webmastersgallery.com/2015/11/'>November 2015</a></li>
<li><a href='http://www.webmastersgallery.com/2015/10/'>October 2015</a></li>
<li><a href='http://www.webmastersgallery.com/2015/09/'>September 2015</a></li>
<li><a href='http://www.webmastersgallery.com/2015/08/'>August 2015</a></li>
<li><a href='http://www.webmastersgallery.com/2015/07/'>July 2015</a></li>
<li><a href='http://www.webmastersgallery.com/2015/06/'>June 2015</a></li>
<li><a href='http://www.webmastersgallery.com/2015/05/'>May 2015</a></li>
<li><a href='http://www.webmastersgallery.com/2015/04/'>April 2015</a></li>
<li><a href='http://www.webmastersgallery.com/2015/03/'>March 2015</a></li>
<li><a href='http://www.webmastersgallery.com/2015/02/'>February 2015</a></li>
<li><a href='http://www.webmastersgallery.com/2015/01/'>January 2015</a></li>
<li><a href='http://www.webmastersgallery.com/2014/12/'>December 2014</a></li>
<li><a href='http://www.webmastersgallery.com/2014/11/'>November 2014</a></li>
<li><a href='http://www.webmastersgallery.com/2014/10/'>October 2014</a></li>
<li><a href='http://www.webmastersgallery.com/2014/09/'>September 2014</a></li>
<li><a href='http://www.webmastersgallery.com/2014/08/'>August 2014</a></li>
<li><a href='http://www.webmastersgallery.com/2014/07/'>July 2014</a></li>
<li><a href='http://www.webmastersgallery.com/2014/06/'>June 2014</a></li>
<li><a href='http://www.webmastersgallery.com/2013/07/'>July 2013</a></li>
<li><a href='http://www.webmastersgallery.com/2013/01/'>January 2013</a></li>
<li><a href='http://www.webmastersgallery.com/2012/12/'>December 2012</a></li>
<li><a href='http://www.webmastersgallery.com/2012/08/'>August 2012</a></li>
<li><a href='http://www.webmastersgallery.com/2012/07/'>July 2012</a></li>
<li><a href='http://www.webmastersgallery.com/2012/06/'>June 2012</a></li>
<li><a href='http://www.webmastersgallery.com/2012/05/'>May 2012</a></li>
<li><a href='http://www.webmastersgallery.com/2012/04/'>April 2012</a></li>
<li><a href='http://www.webmastersgallery.com/2012/01/'>January 2012</a></li>
<li><a href='http://www.webmastersgallery.com/2011/11/'>November 2011</a></li>
<li><a href='http://www.webmastersgallery.com/2011/06/'>June 2011</a></li>
<li><a href='http://www.webmastersgallery.com/2011/03/'>March 2011</a></li>
<li><a href='http://www.webmastersgallery.com/2011/02/'>February 2011</a></li>
<li><a href='http://www.webmastersgallery.com/2011/01/'>January 2011</a></li>
<li><a href='http://www.webmastersgallery.com/2010/12/'>December 2010</a></li>
<li><a href='http://www.webmastersgallery.com/2010/11/'>November 2010</a></li>
<li><a href='http://www.webmastersgallery.com/2010/09/'>September 2010</a></li>
<li><a href='http://www.webmastersgallery.com/2010/07/'>July 2010</a></li>
<li><a href='http://www.webmastersgallery.com/2010/06/'>June 2010</a></li>
<li><a href='http://www.webmastersgallery.com/2010/05/'>May 2010</a></li>
<li><a href='http://www.webmastersgallery.com/2010/02/'>February 2010</a></li>
<li><a href='http://www.webmastersgallery.com/2009/12/'>December 2009</a></li>
<li><a href='http://www.webmastersgallery.com/2009/08/'>August 2009</a></li>
<li><a href='http://www.webmastersgallery.com/2009/07/'>July 2009</a></li>
<li><a href='http://www.webmastersgallery.com/2009/06/'>June 2009</a></li>
<li><a href='http://www.webmastersgallery.com/2009/05/'>May 2009</a></li>
<li><a href='http://www.webmastersgallery.com/2009/04/'>April 2009</a></li>
<li><a href='http://www.webmastersgallery.com/2009/03/'>March 2009</a></li>
</ul>
</div>
<!-- meta -->
<div class="widget">
<h3>Meta</h3>
<ul>
<li><a href="http://www.webmastersgallery.com/wp-login.php">Log in</a></li>
</ul>
</div>
</div>
<!-- sidebar south END -->
</div>
<!-- sidebar END -->
<div class="fixed"></div>
</div>
<!-- content END -->
<!-- footer START -->
<div id="footer">
<a id="gotop" href="#" onclick="MGJS.goTop();return false;">Top</a>
<a id="powered" href="http://wordpress.org/">WordPress</a>
<div id="copyright">
Copyright © 2009-2024 Webmasters Gallery </div>
<div id="themeinfo">
Theme by <a href="http://www.neoease.com/">NeoEase</a>. Valid <a href="http://validator.w3.org/check?uri=referer">XHTML 1.1</a> and <a href="http://jigsaw.w3.org/css-validator/check/referer?profile=css3">CSS 3</a>. </div>
</div>
<!-- footer END -->
</div>
<!-- container END -->
</div>
<!-- wrap END -->
</body>
</html>